
Elliott Wave chart analysis for the S&P 500 for 18th April, 2011. Please click on the charts below to enlarge.
As expected Monday’s session saw downwards movement from the S&P to move price closer to the target for wave 2 pink.
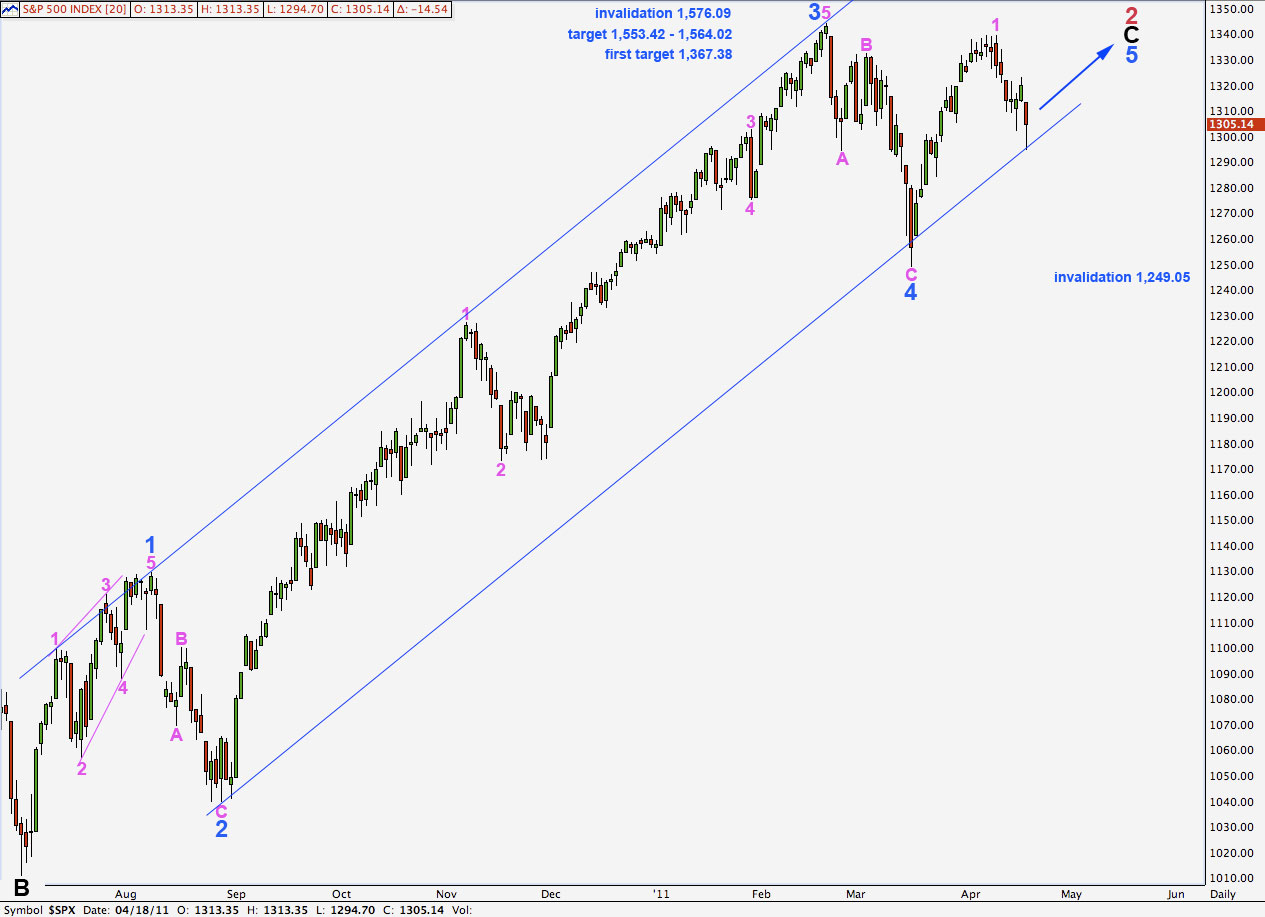
Downwards movement has found strong support at the lower edge of the wide blue channel here on the daily chart.
We will be expecting one final wave down to end this second wave correction. We may see a small overshoot of this channel before price turns back upwards for a strong third wave.
At 1,367.38 wave 5 blue will reach equality with wave 1 blue. This target may be too low. When price approaches this first target, if the structure requires further upwards movement, we will use the second target.
At 1,553.42 wave 5 blue will reach equality with wave 3 blue. At 1,564.02 wave C black will reach equality with wave A black. This is the second more likely target for primary wave 2 to end.
At this stage we can see a complete five wave structure within wave 5 blue. However, wave behaviour does not support a wave count which sees primary wave 3 underway. When primary wave 3 arrives we should see very strong downwards movement.
When the wide blue channel drawn here about wave C black impulse is breached to the downside with at least a full daily candlestick below it then we shall have confirmation of a trend change at primary degree.
Wave 2 pink may not move beyond the start of wave 1 pink. This wave count is invalidated with movement below 1,249.05.
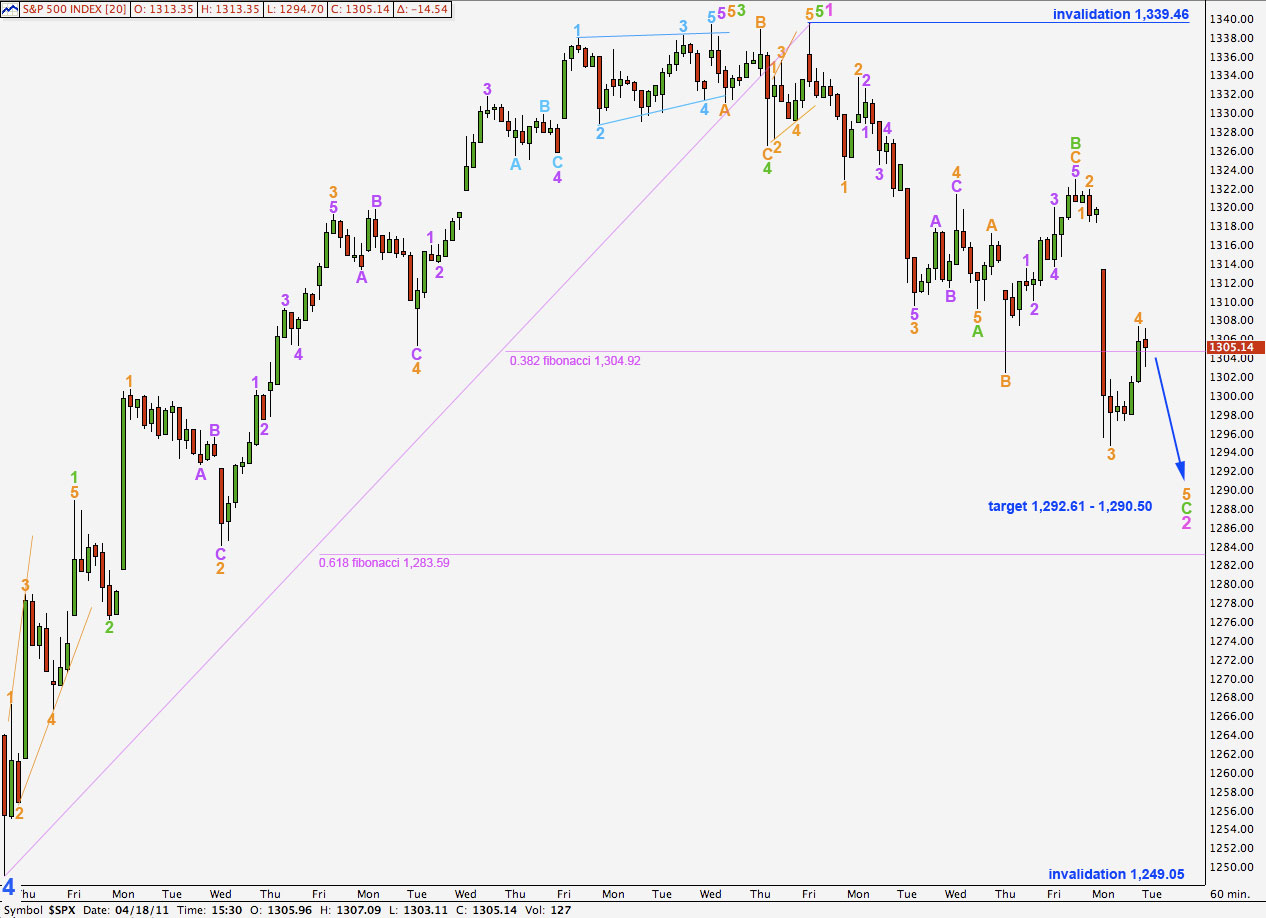
Wave C green is an incomplete impulse. It requires a final fifth wave downwards to end it.
Wave 3 orange is just 0.66 points longer than 11.09 times the length of wave 1 orange.
At 1.292.61 wave C green will reach equality with wave A green. At 1,290.50 wave 5 orange will reach 0.618 the length of wave 3 orange. This is our target for the next small downwards wave to end.
It is most likely that the second wave correction would be over there and would not continue sideways as a double zigzag or double combination. It would be in proportion to the first wave at pink degree and it would be contained within the channel on the daily chart.
The next most likely move then would be a third wave upwards.
When we have a known end for wave 2 pink then we may calculate a target upwards for wave 3 pink.