
Elliott Wave chart analysis for the S&P 500 for 15th April, 2011. Please click on the charts below to enlarge.
Movement above 1,317.16 confirmed our main hourly wave count and invalidated the alternate. At that stage we expected further upwards movement towards the target at 1,323.29. Upwards movement ended 0.41 points short of the target at 1,322.88 so far.
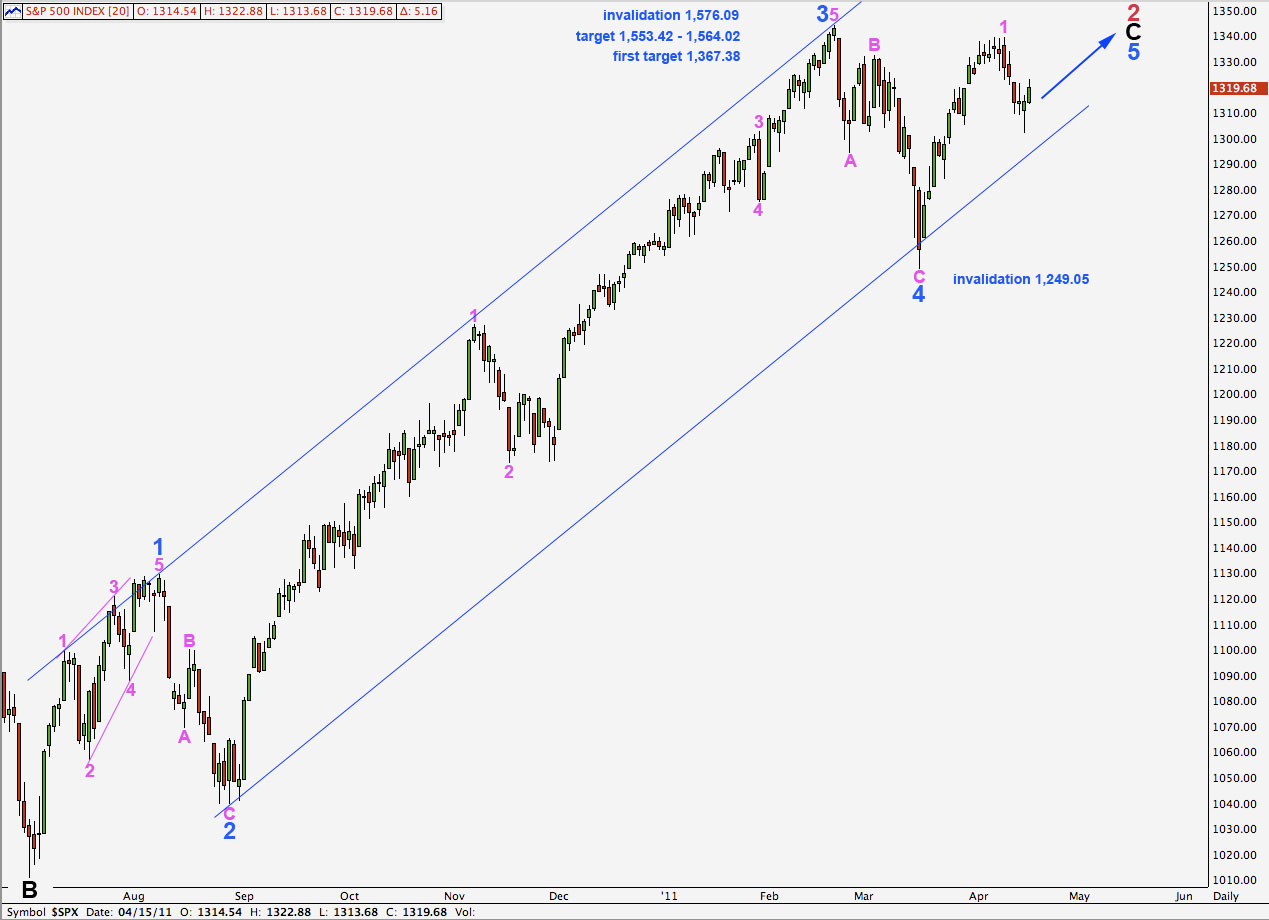
It is most likely that wave B green within wave 2 pink is complete. Next week should see downwards movement as wave 2 pink completes.
When this second wave correction is over the S&P should resume steady upwards movement towards the targets for wave 5 blue.
At 1,367.38 wave 5 blue will reach equality with wave 1 blue. This target may be too low. When price approaches this first target, if the structure requires further upwards movement, we will use the second target.
At 1,553.42 wave 5 blue will reach equality with wave 3 blue. At 1,564.02 wave C black will reach equality with wave A black. This is the second more likely target for primary wave 2 to end.
At this stage we can see a complete five wave structure within wave 5 blue. However, wave behaviour does not support a wave count which sees primary wave 3 underway. When primary wave 3 arrives we should see very strong downwards movement.
When the wide blue channel drawn here about wave C black impulse is breached to the downside with at least a full daily candlestick below it then we shall have confirmation of a trend change at primary degree.
Wave 2 pink may not move beyond the start of wave 1 pink. This wave count is invalidated with movement below 1,249.05.
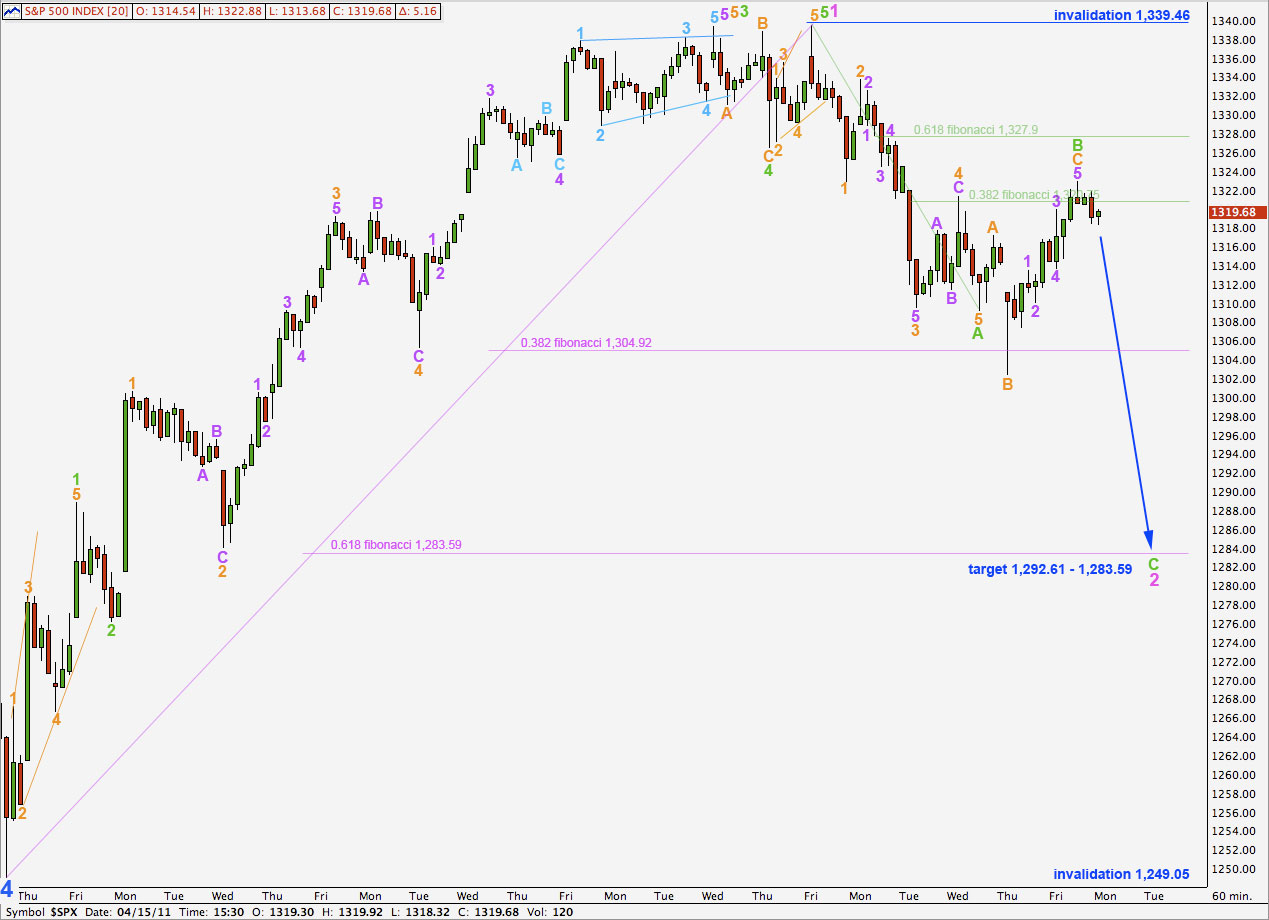
Wave B green has ended with an overshoot of the 0.382 fibonacci ratio of wave 1 green. This has a very typical look.
Within wave B green wave C orange is 0.41 points short of 2.618 the length of wave A orange.
Ratios within wave C orange are: wave 3 purple has no ratio to wave 1 purple and wave 5 purple is 0.68 points short of equality with wave 3 purple.
Wave C green will reach equality with wave A green at 1,292.61. Our target for downwards movement to end next week is about the 0.618 ratio at 1,283.59 to 1,292.61. When we have more of wave C green to analyse this target may be refined.
Wave A green lasted 4 days. We may expect wave C green to last about the same duration. This downwards movement is likely to end next week.
Any further upwards movement of wave C orange within wave B green may not move beyond the start of wave A green. This wave count is invalidated with movement above 1,339.46.
Wave 2 pink may not move beyond the start of wave 1 pink. This wave count is invalidated with movement below 1,249.05.