
Elliott Wave chart analysis for the S&P 500 for 14th April, 2011. Please click on the charts below to enlarge.
We were expecting some downwards movement yesterday from the S&P from both yesterday’s hourly wave counts. We have seen a little downwards movement followed by a little upwards movement. Price has remained below 1,317.16 and so both of our hourly wave counts remain valid.
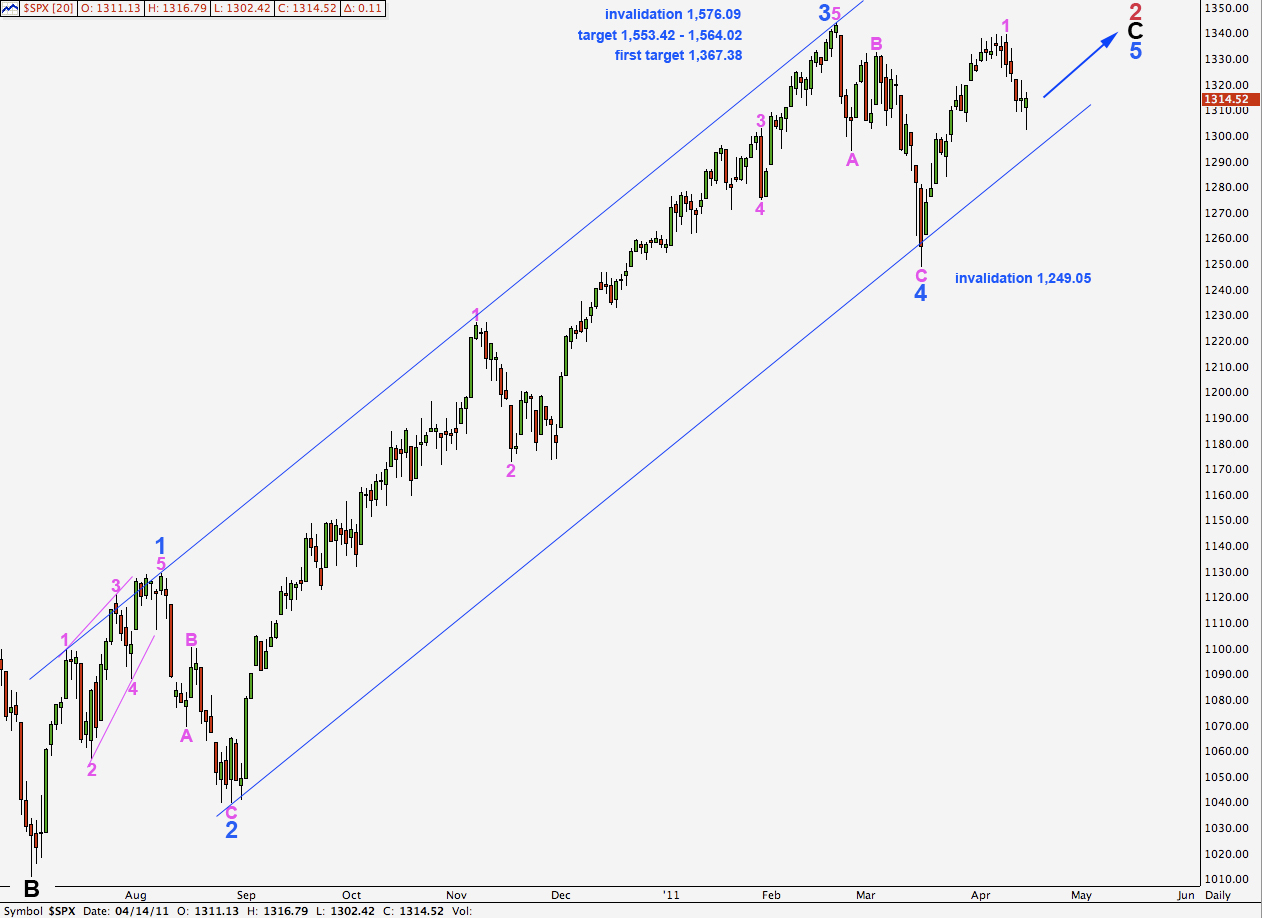
Wave 2 pink has further downwards movement yet before it is a complete zigzag.
Wave 2 pink may not move beyond the start of wave 1 pink. This wave count is invalidated with movement below 1,249.05.
When wave 2 pink is complete we will expect a strong third wave upwards to take price above 1,339.46 as wave 3 pink must move beyond the end of wave 1.
This wave count expects overall upwards movement for the next few weeks if not months towards targets for wave 5 blue to end. At this stage the first target may be too low and the second target is looking more likely.
Primary wave 2 zigzag may not move beyond the start of primary wave 1. This wave count is invalidated with movement above 1,576.09.
Main Wave Count.
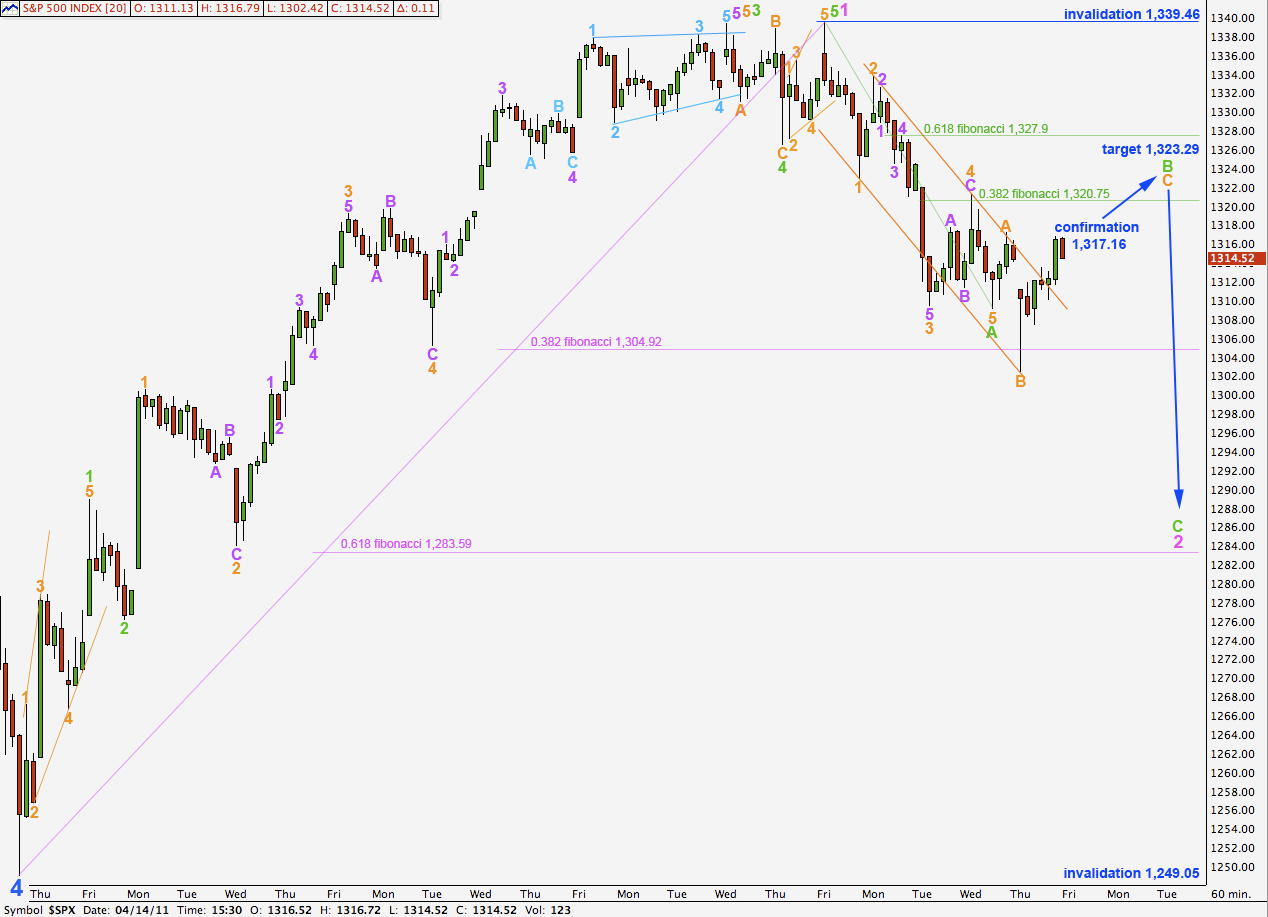
This main hourly wave count expected a little downwards movement for wave B orange before price turned upwards for wave C orange.
Wave B orange is 185% of wave A orange. If wave C orange reaches 2.618 the length of wave A this B wave at green degree expanded flat correction will end about 1,323.29.
Thereafter, we should see further downwards movement for wave C green to end wave 2 pink.
It is technically possible that wave B green is over already as a rare running flat correction. Wave C orange has so far not reached above the high labeled A orange. The rarity of this structure means the probability of upwards movement for wave B orange being over is very low.
Alternate Wave Count.
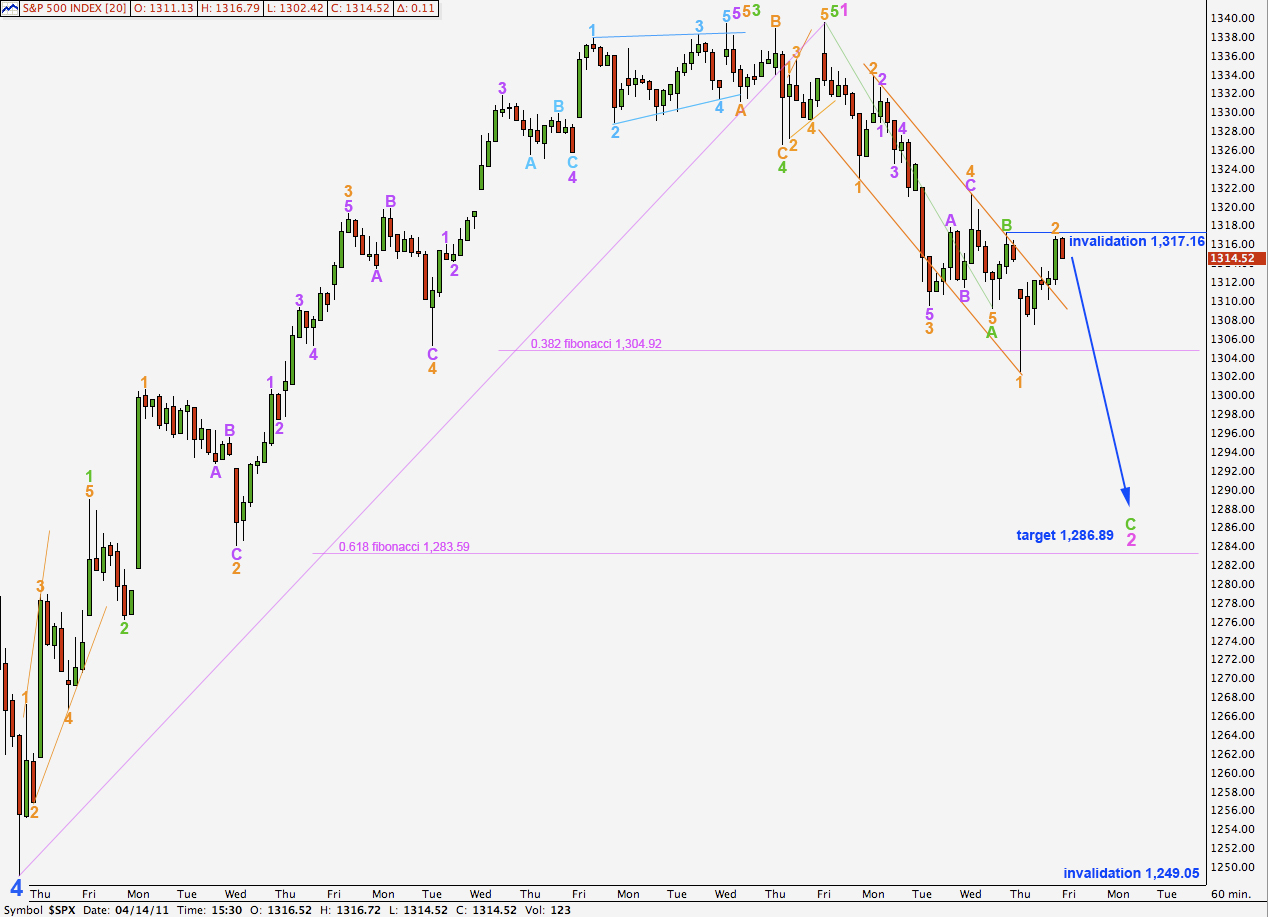
The structure on a 15 minute and 5 minute chart for wave 2 orange does not look like a three. It looks most like a five wave diagonal. Although this wave count remains technically valid I would expect that wave 2 orange is incomplete and requires two more waves to complete it. Movement above 1,317.16 would invalidate this wave count as wave 2 may not move beyond the start of wave 1.
At 1,286.89 wave C green will reach equality with wave A green. This point is close to the 0.618 fibonacci ratio for wave 1 pink which is at 1,283.59. This is our target for downwards movement for wave 2 pink to end.