
Elliott Wave chart analysis for the S&P 500 for 8th April, 2011. Please click on the charts below to enlarge.
We saw a little more downwards movement to end the trading week and we now have a very rare expanding triangle in a fourth wave position.
Because a triangle may not be the first structure of a double combination the completion of this triangle indicates an end to this correction.
We are most likely to see upwards movement for Monday’s session.
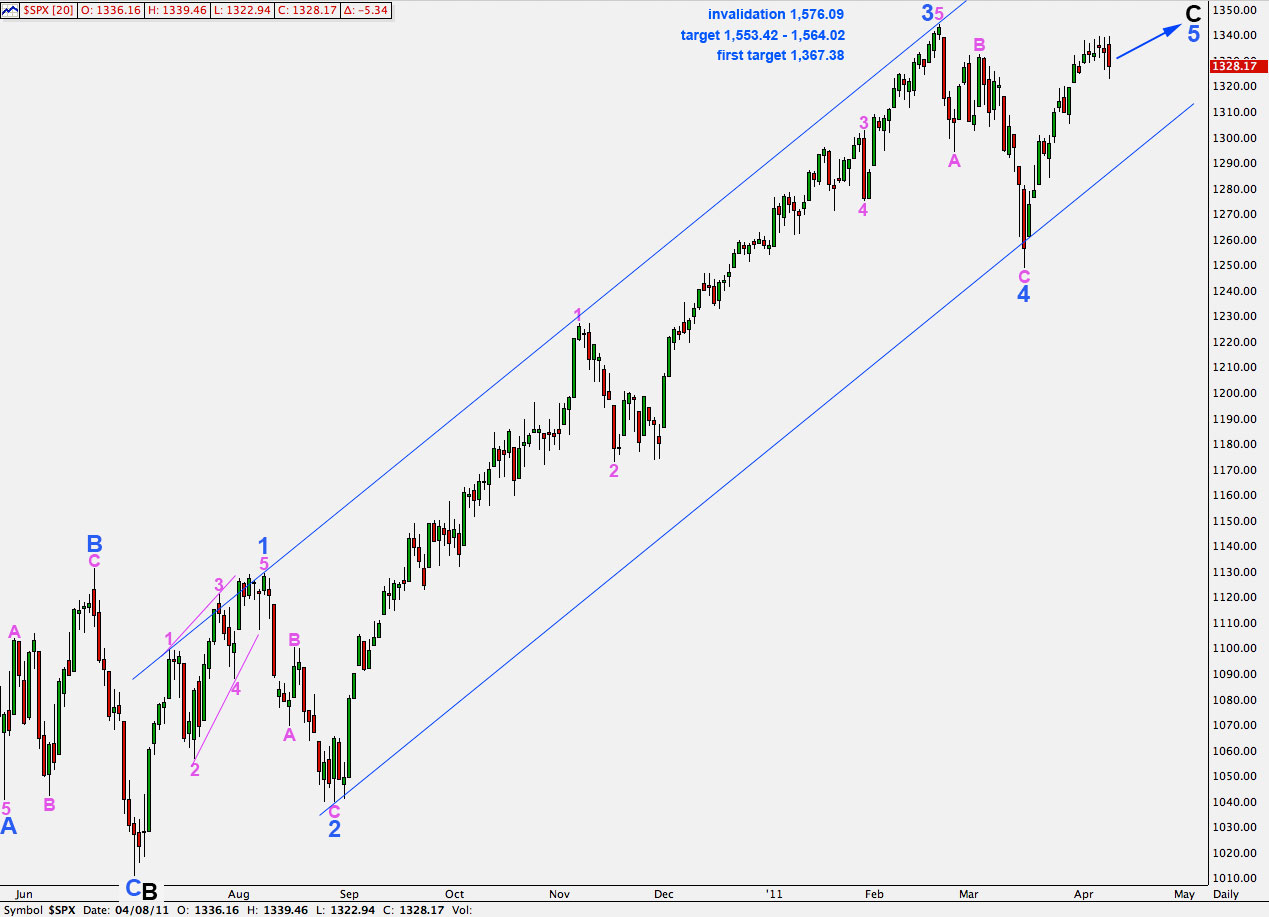
When one more wave upwards is complete we shall have a complete impulsive structure within wave 5 blue. At that stage we must consider the possibility that upwards movement may be over for primary wave 2. We shall use an alternate wave count for this possibility.
At 1,367.38 wave 5 blue will reach equality with wave 1 blue. This may be where our next upwards fifth wave at green degree ends.
A more likely target for wave 5 blue is 1,553.42 to 1,564.02 where wave 5 blue will be close to equality with wave 3 blue and wave C black will be close to equality with wave A black.
This wave count is invalidated with movement above 1,576.09.
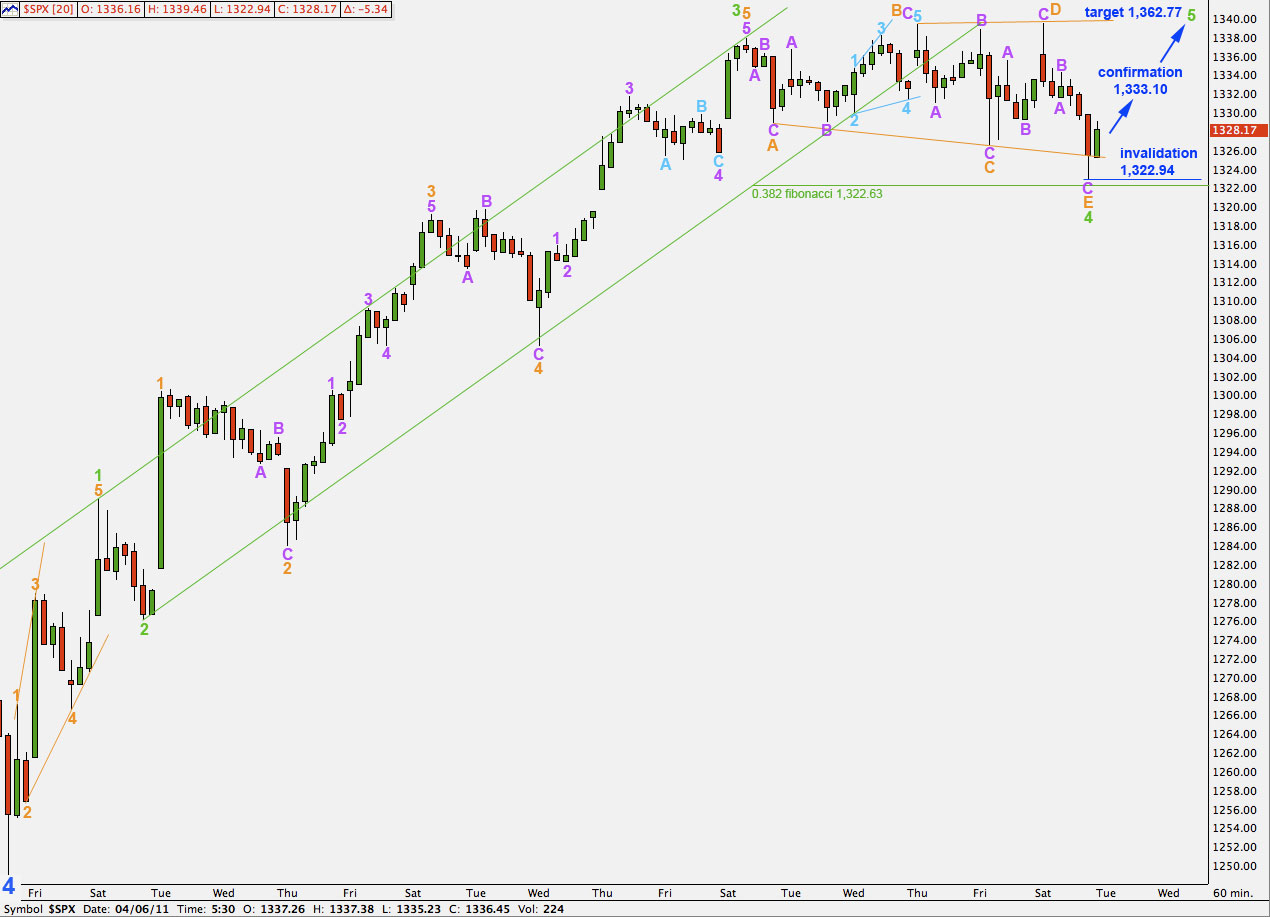
Movement below the first invalidation point of 1,326.56 invalidated the double combination structure and indicated the possibility of an expanding triangle.
At that point the most likely place for the triangle to end was about the 0.382 fibonacci ratio of wave 3 green, at 1,322.63.
Wave E of the triangle has reached almost to this point, ending at 1,322.94.
The problem with rare structures like this is that they will always have a low probability due to the rarity. When they occur we will always be expecting something else, such as a more common structure.
Within a combination correction we may not see a triangle as the first of two structures. So we can eliminate the possibility of this fourth wave continuing yet further sideways as a combination.
Wave E of an expanding triangle has never been observed to subdivide into a triangle itself; we can eliminate the possibility of this structure continuing on further sideways as an extended E wave.
Wave 4 green is now a complete expanding triangle and so it should be over here. On the 15 minute chart wave E zigzag looks complete: wave A within it has a count of 5 and is a perfect impulse, wave B purple is short, and wave C purple has a count of 9 and is a complete impulse with a long fifth wave. Within wave C purple, on the 15 minute chart, the end of wave 1 would be at 1,333.10. Movement above this point cannot be a fourth wave correction within wave C purple and so will indicate that wave C is over. At that stage we may have more confidence that wave 5 green is underway.
At 1,362.77 wave 5 green will reach equality with wave 1 green. This price point is still close to the first target of 1,367.38 on the daily chart for wave 5 blue to end primary wave 2.
Movement below 1,322.94 would invalidate this wave count. If this happens before the confirmation point above is reached it may indicate an extension of wave C purple to end wave E orange of the triangle. If this happens after the confirmation point is reached the wave count is invalid.