
Elliott Wave chart analysis for the S&P 500 for 7th April, 2011. Please click on the charts below to enlarge.
We had expected upwards movement from the S&P for Thursday’s session and this is not what we have seen. Wave 4 green has extended further sideways with a little lower breach, by 4.53 points, of our lower invalidation point on the hourly chart. Thereafter, we have seen more sideways movement.
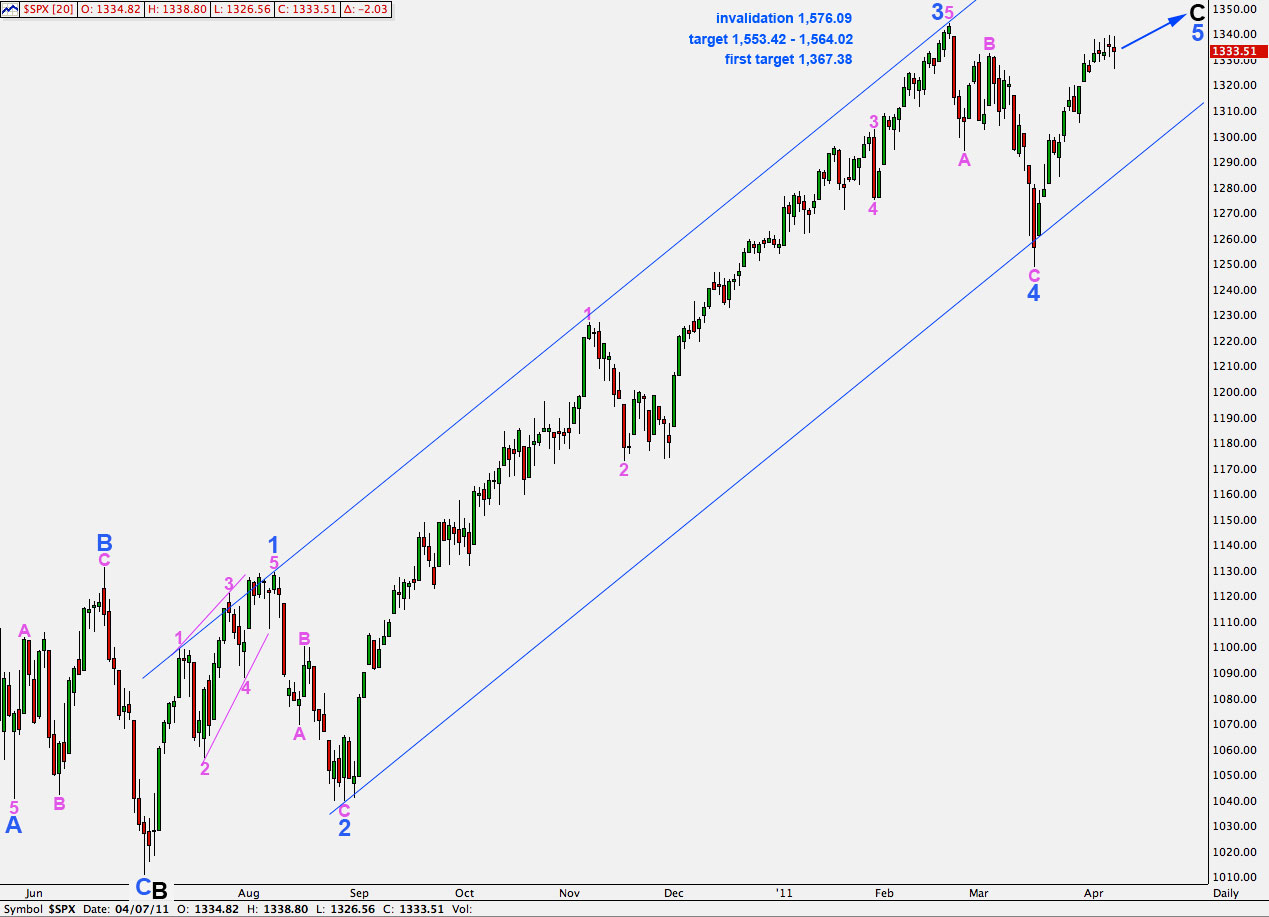
It is likely that wave 4 green is now over. The next move for the S&P should be a final upwards wave to end the first five wave structure within wave 5 blue.
At 1,367.38 wave 5 blue will reach equality with wave 1 blue. This may be where our next upwards fifth wave at green degree ends.
When we have a complete five wave structure within wave 5 blue we will have to use an alternate wave count to consider the possibility that it may end there. However, at this stage this structure is incomplete and requires further upwards movement.
A more likely target for wave 5 blue is 1,553.42 to 1,564.02 where wave 5 blue will be close to equality with wave 3 blue and wave C black will be close to equality with wave A black.
This wave count is invalidated with movement above 1,576.09.
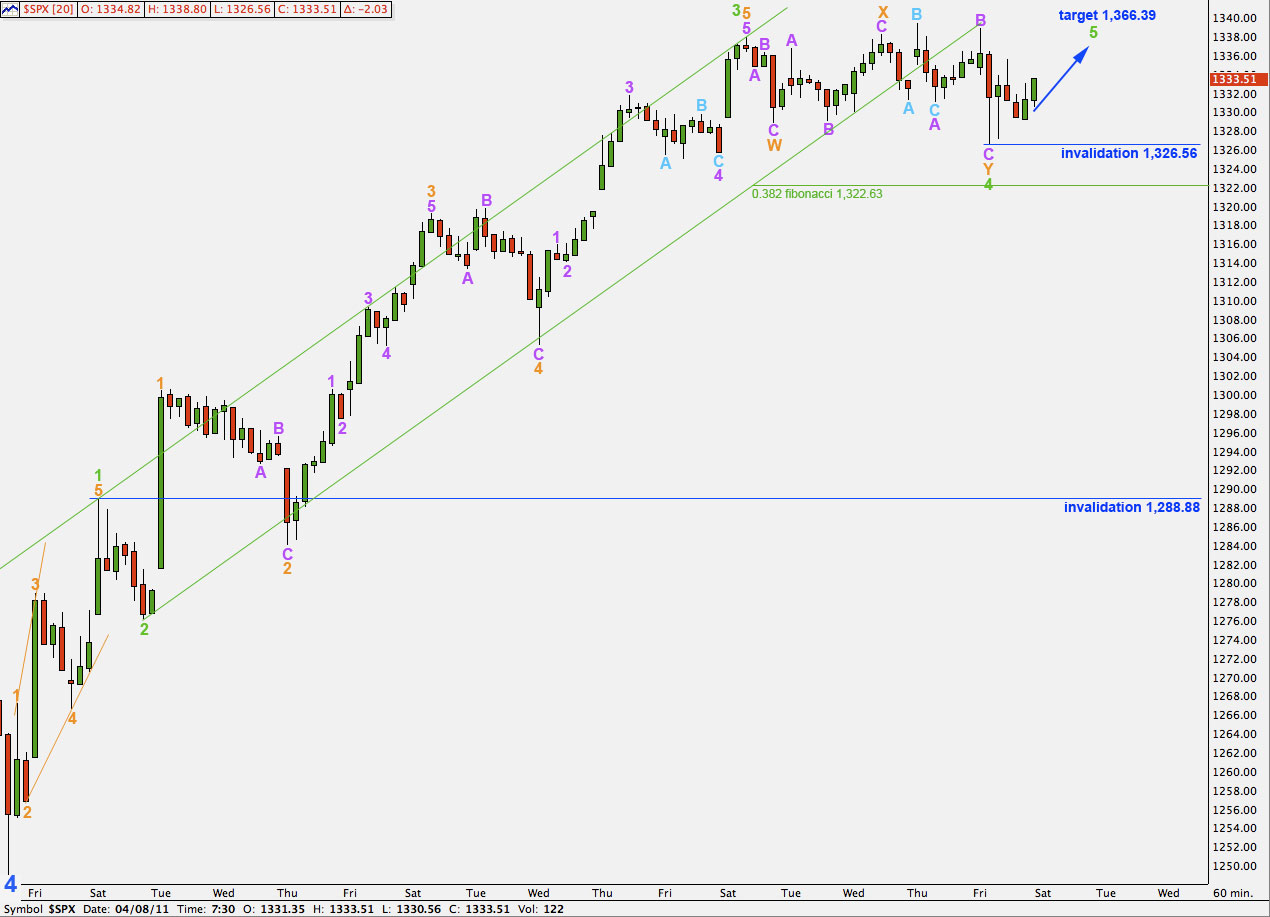
Wave 4 green is labeled mostly the same as yesterday and it is still seen as a double combination correction: zigzag – X – expanded flat.
The second structure in this combination, the expanded flat labeled Y orange, has extended further. What we had yesterday labeled as a complete structure was only wave A within this expanded flat.
Within wave Y orange wave C purple is now just 0.72 points longer than 1.618 the length of wave A purple. This sideways and slightly lower movement has managed to achieve a much better fibonacci ratio than we had previously seen.
Upwards movement from the low at 1,326.56 so far looks like a three waves up on the 15 minute chart. This may be a series of first and second waves within wave 5 green.
The only other possibility I can see at this stage would be a continuation of sideways movement within an increasing range for wave 4 green as it completes a very rare expanding triangle structure. This would give wave 4 green an out of proportion look to it’s counterpart wave 2 green. Also, the rarity of this structure means this possibility has a very low probability.
If this wave count is invalidated by movement below 1,326.56 then we shall have to more seriously consider a possible expanding triangle for wave 4 green.
At this stage it seems most likely that we shall see upwards movement tomorrow from the S&P as wave 5 green develops.
At 1,366.39 wave 5 green will reach 1.618 the length of wave 1 green. This price point is now even closer to the daily chart target of 1,367.38 where wave 5 blue will reach equality with wave 1 blue.