
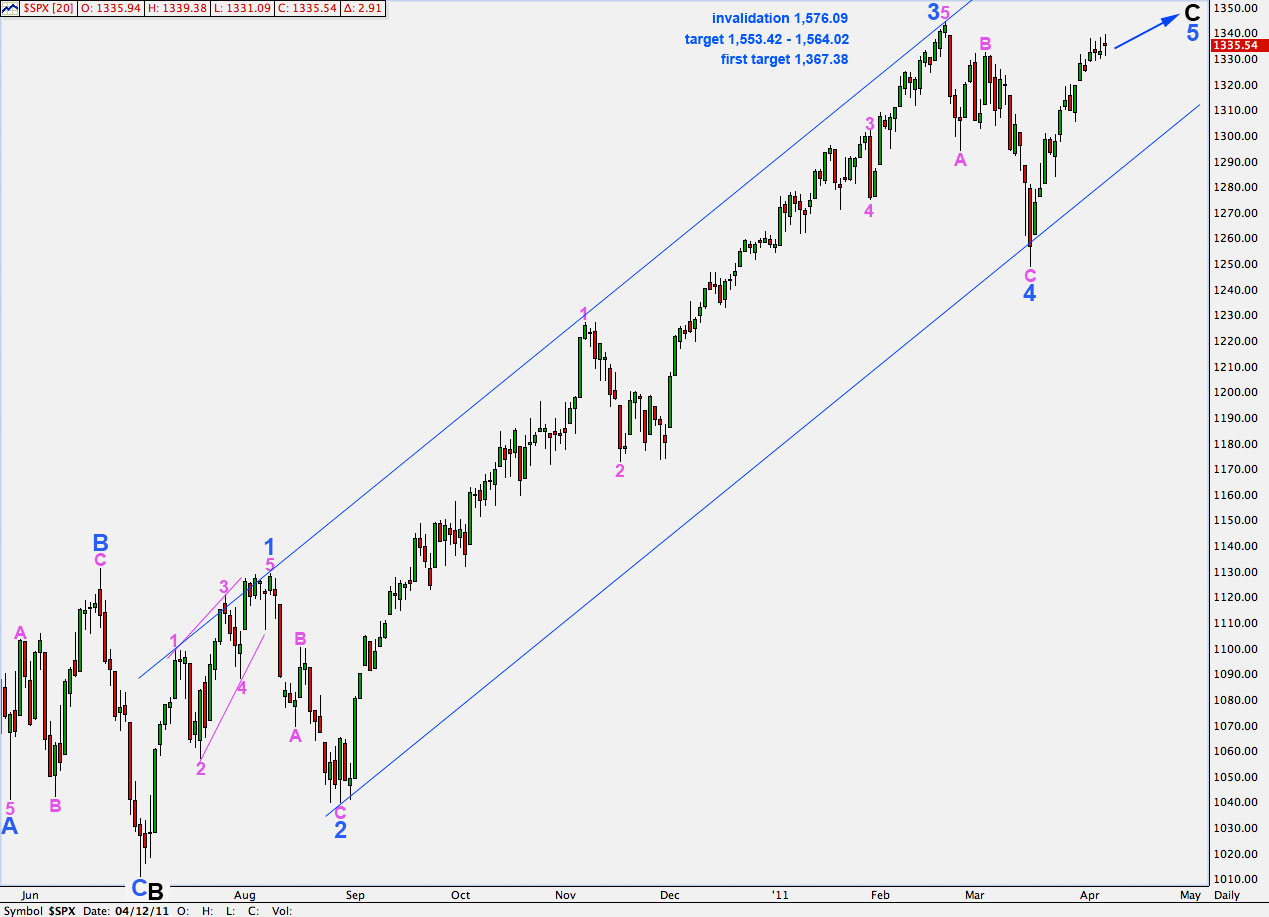
Elliott Wave chart analysis for the S&P 500 for 6th April, 2011.
We were expecting a little downwards movement to a target at 1,322.63 to 1,325.82. We did not get this and wave 4 green has most likely ended during Wednesday’s session at 1,331.09 which is 8.46 points above our target zone.
At 1,367.38 wave 5 blue will reach equality with wave 1 blue. This may be where our next upwards fifth wave at green degree ends.
When we have a complete five wave structure within wave 5 blue we will have to use an alternate wave count to consider the possibility that it may end there. However, at this stage this structure is incomplete and requires further upwards movement.
A more likely target for wave 5 blue is 1,553.42 to 1,564.02 where wave 5 blue will be close to equality with wave 3 blue and wave C black will be close to equality with wave A black.
This wave count is invalidated with movement above 1,576.09.
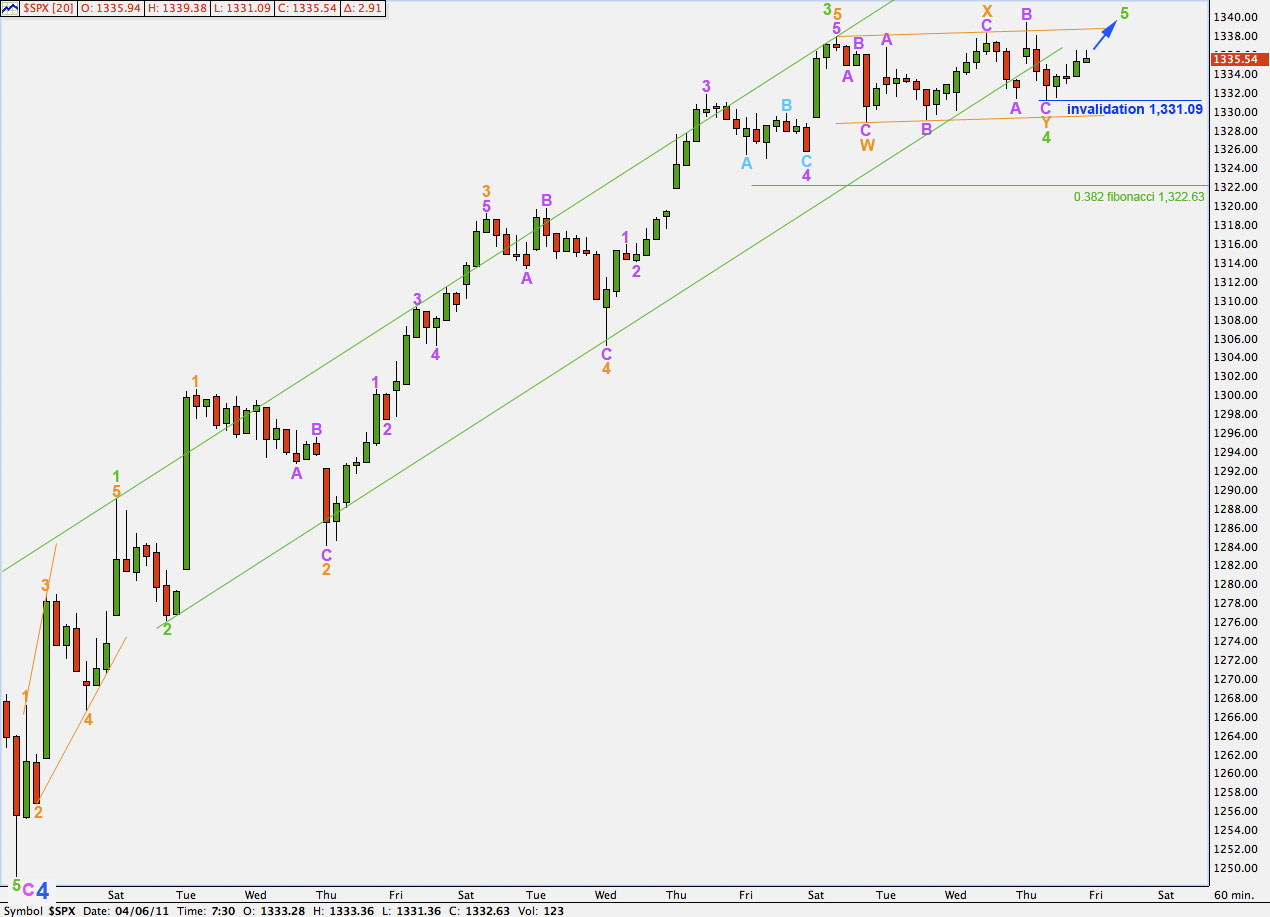
Wave 4 green was not likely to have been a simple flat correction. It is labeled here as a double combination: zigzag – X – flat.
Within wave W orange zigzag wave C purple is just 0.61 points longer than 2.618 the length of wave A purple.
Wave X orange to join the two structures in this combination is a regular flat correction. Wave B purple is a 97 percent correction of wave A purple and wave C has no relationship to wave A.
Wave Y orange as the second structure in this double is an expanded flat correction. Wave B purple is a 117 percent correction of wave A purple and there is no relationship between waves A and C purple.
If wave 4 green has ended here then we should not see movement below 1,3331.09 as a second wave correction within wave 5 green may not move beyond the start of the first wave.
If this wave count is invalidated by downwards movement then it is likely that wave C purple within wave Y orange is extending lower. At 1,328.3 wave C purple will reach 1.618 the length of wave A purple.
We need to see movement above 1,339.38 to eliminate the possibility of wave 4 green taking price lower. At that stage we may have more confidence that this fourth wave correction is over and the fifth wave upwards is underway.
At 1,370.92 wave 5 green will reach equality with wave 1 green. This point is very close to our first target for wave 5 blue on the daily chart.
If we move the degree of labeling on this chart all up one degree we can see that shortly we may have a complete wave structure for wave 5 blue.
When this structure is complete we shall have to use an alternate wave count to consider the possibility that wave 5 blue and therefore primary wave 2 zigzag is complete.