
Elliott Wave chart analysis for the S&P 500 for 5th April, 2011. Please click on the charts below to enlarge.
Upwards movement within this fourth wave correction has invalidated the hourly wave count for a contracting triangle and confirmed the wave count which saw a flat unfolding in this fourth wave position.
When this fourth wave is complete we shall expect a resumption of upwards movement. When the fifth wave is complete we will be faced with the possibility that wave 5 blue may be over and we shall have an alternate wave count at that stage. We should always assume that the trend remains the same, until proved otherwise. So we will have a trend change price point to indicate a possible trend change at that stage.
At this stage we will expect a little further downwards movement for this fourth wave to end before a resumption of the upwards trend.
This fourth wave correction may end during or at the end of tomorrow’s session.
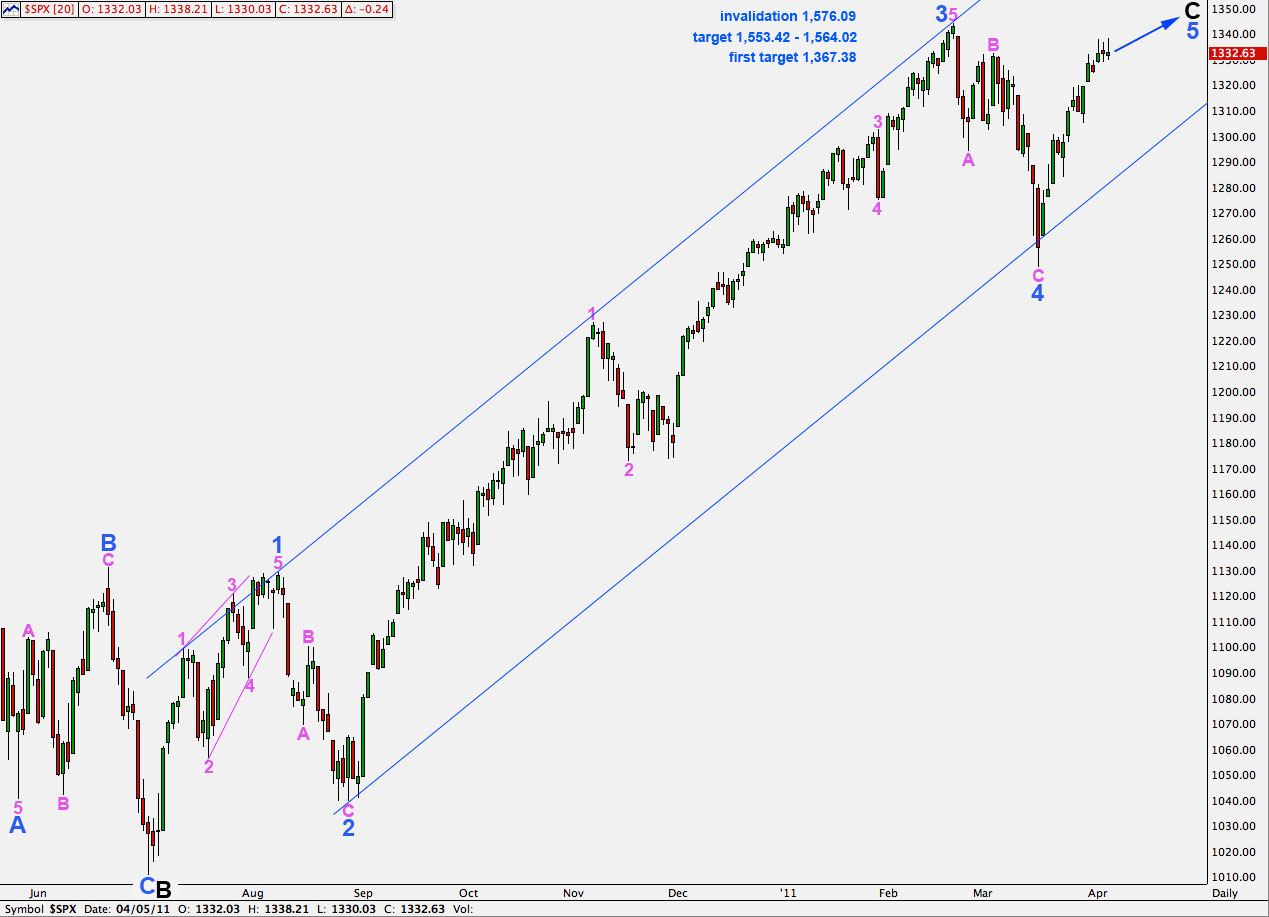
At 1,367.38 wave 5 blue will reach equality with wave 1 blue. This may be where our next upwards fifth wave at green degree ends.
A more likely target for wave 5 blue is 1,553.42 to 1,564.02 where wave 5 blue will be close to equality with wave 3 blue and wave C black will be close to equality with wave A black.
This wave count is invalidated with movement above 1,576.09.
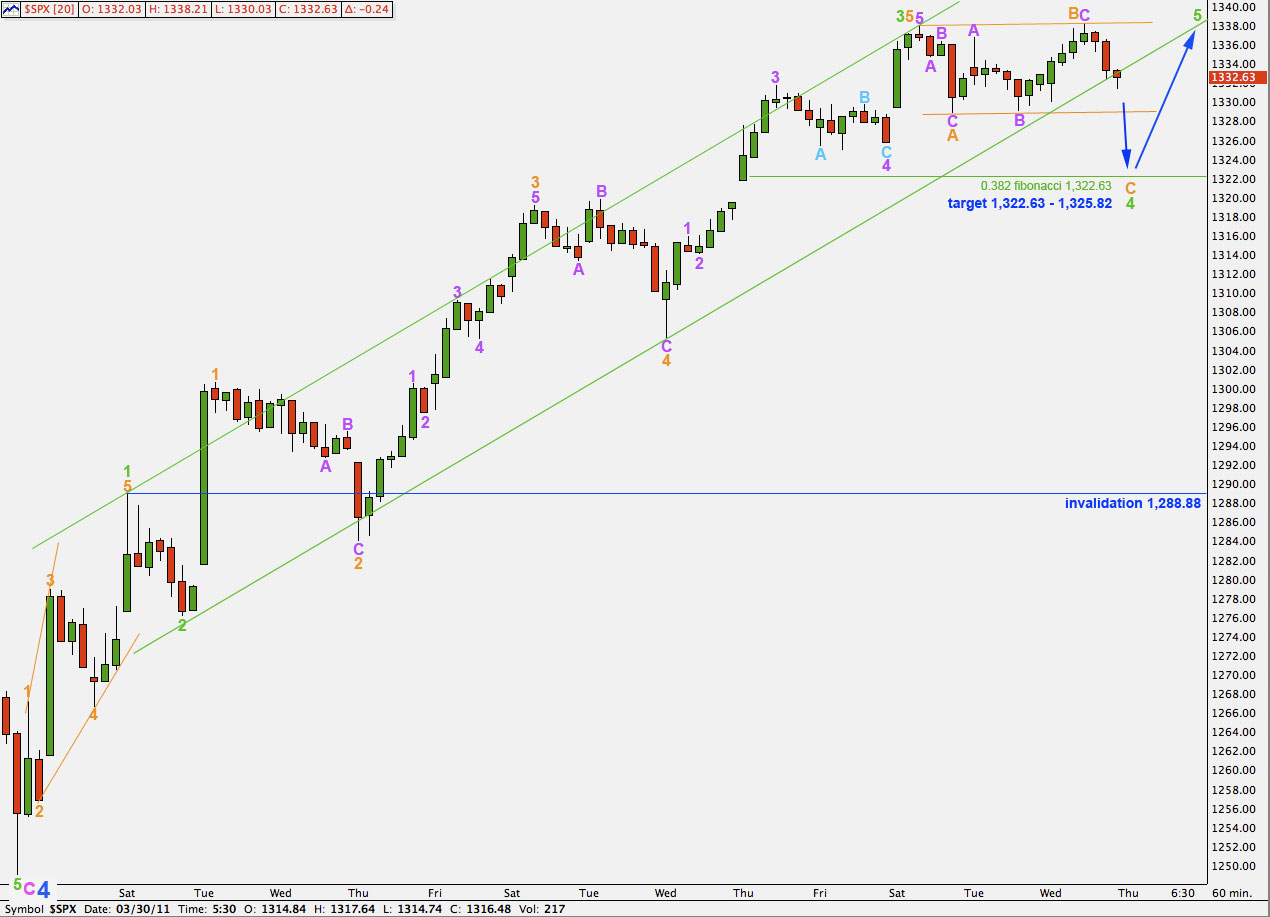
As expected Tuesday’s session began with upwards movement. Movement above 1,336.74 has invalidated the contracting triangle structure as it was labeled yesterday. It looks unlikely at this stage that wave 4 green is a triangle. This structure looks like a typical flat correction.
At 1,322.63 wave 4 green will reach down to the 0.382 fibonacci ratio of wave 3 green.
At 1,325.82 wave 4 green will reach down to the fourth wave of one lesser degree, wave 4 purple.
At 1,323.71 wave C orange within wave 4 green will reach 1.618 the length of wave A orange.
It is highly likely that wave C orange to end wave 4 green will at least take price to 1,328.89 or below. Failure to do so would see wave C orange truncated and wave 4 green would be a very rare running flat correction. This is technically possible but the probability of this happening is very low.
We may expect wave C orange to overshoot the lower edge of the small orange trend channel drawn here. It is also likely that we will see a reasonable overshoot of the green channel upwards containing this impulse.
A fourth wave overshoot may indicate a fifth wave overshoot may occur on the opposite side of the green channel.
Wave 4 green may not move into wave 1 green price territory. This wave count is invalidated with movement below 1,288.88.
At this stage it seems to be fairly unlikely, but the possibility that wave 4 green may unfold as a very rare expanding triangle does also exist. I will keep this possibility in mind over the next few days and if price continues to move sideways I will chart this for you. I have only ever seen two of these, there is a nice one on the daily chart for the US dollar index currently, but the rarity of these structures means this possibility has a very low probability. Flats are, however, very common structures.