
Elliott Wave chart analysis for the S&P 500 for 4th April, 2011. Please click on the charts below to enlarge.
We had expected further downwards movement for a fourth wave correction and the market has moved sideways. Wave 4 green is most likely to unfold as either a flat or a triangle. We have two wave counts today on the hourly chart to cover these two possibilities.
It is likely that wave 4 green will take another day or two to complete. Thereafter, we should see the resumption of upwards movement as wave 5 green completes a five wave structure upwards.
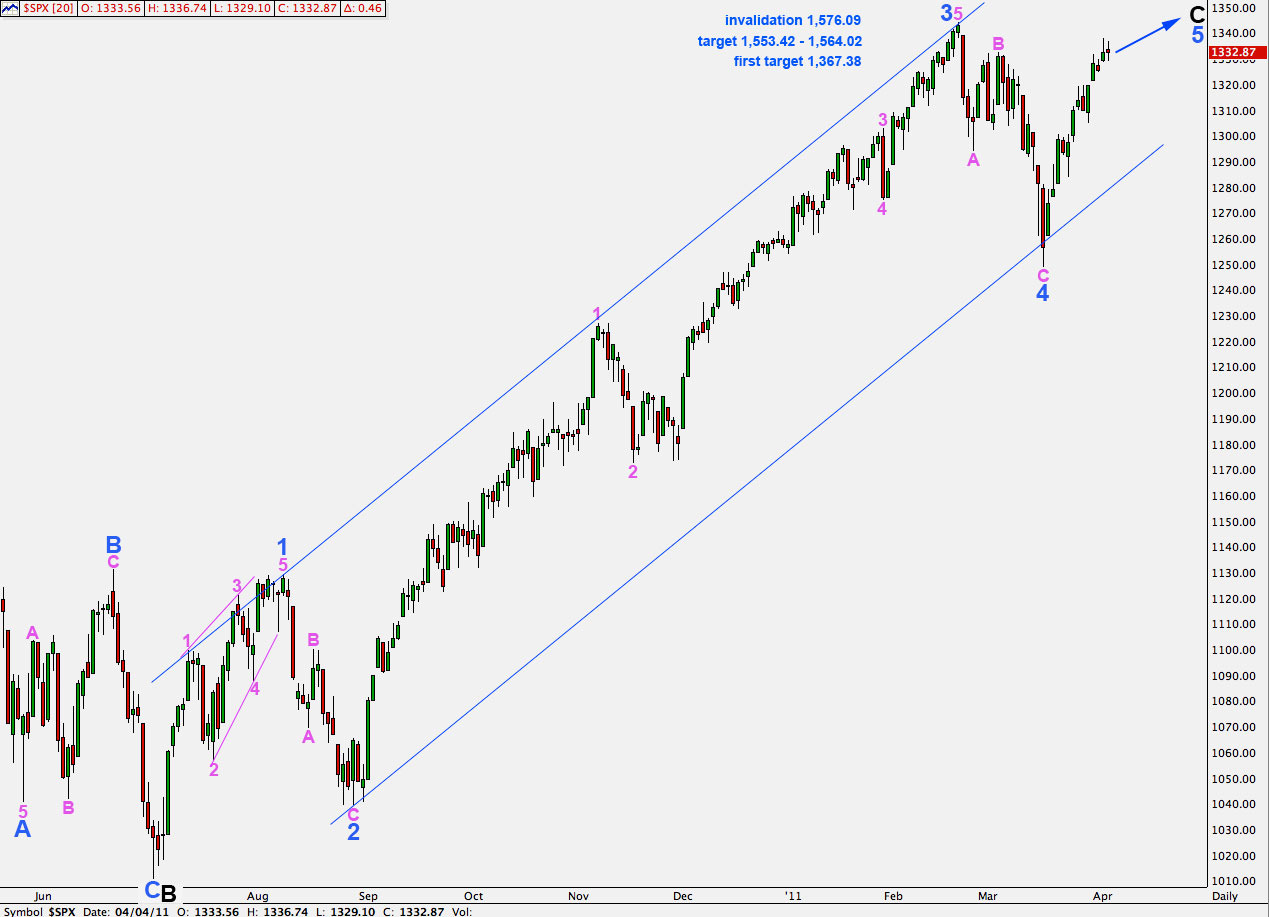
At 1,367.38 wave 5 blue will reach equality with wave 1 blue. About this first target, if there is a satisfactory structure for wave 5 blue, then we must allow for the possibility that primary wave 2 may be over there and we may use an alternate wave count for this.
A more likely target is 1,553.42 to 1,564.02 where wave 5 blue will be close to equality with wave 3 blue and wave C black will be close to equality with wave A black.
This wave count is invalidated with movement above 1,576.09.
Hourly Wave Count – Wave 4 Green As A Flat
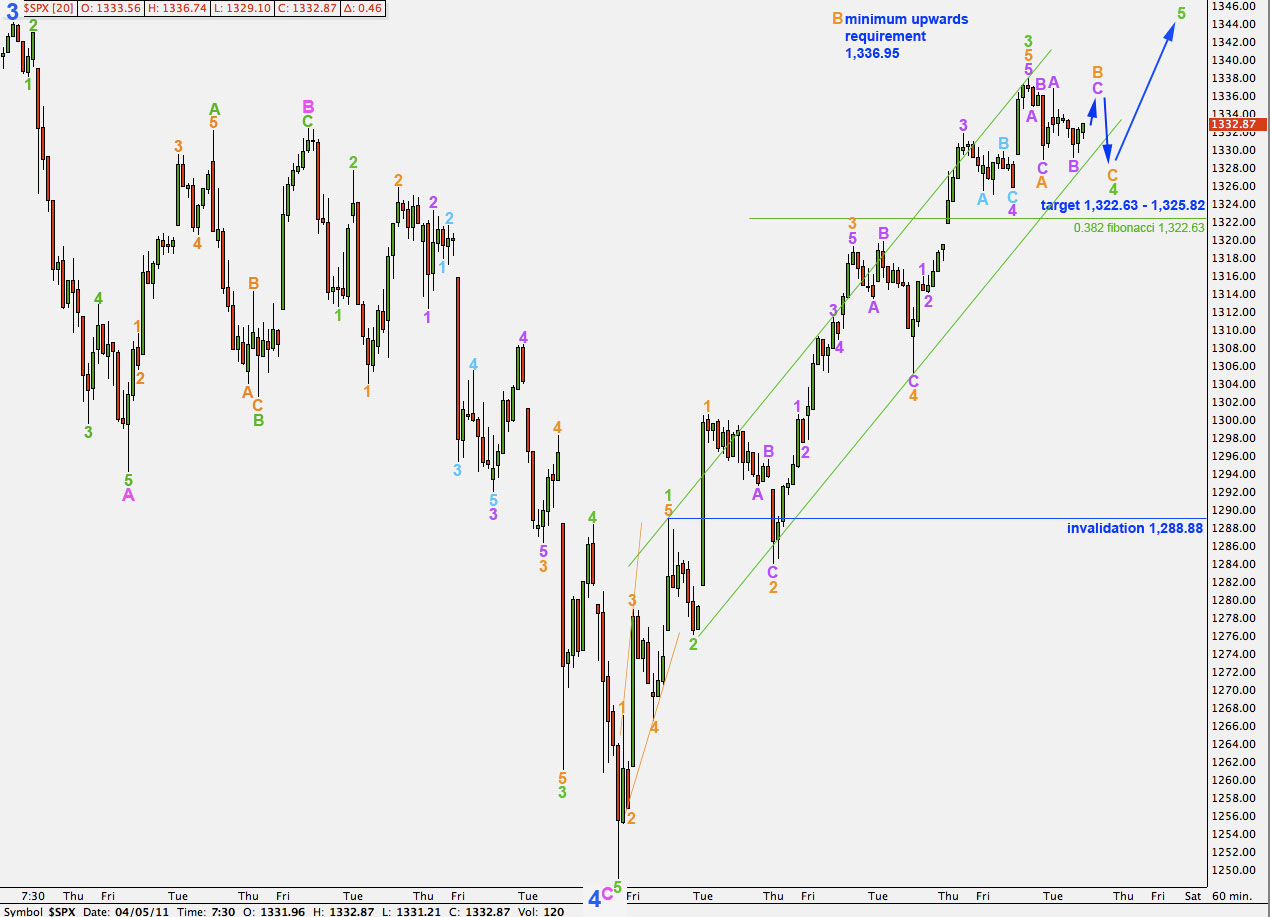
We should expect tomorrow’s session to begin with upwards movement. If this movement reaches above 1,336.6 then it is highly likely to reach at least to 1,336.95.
Wave B orange must reach at least 90% of wave A orange if wave 4 green is to unfold as a flat correction. This is achieved at 1,336.95.
If wave 4 orange is a regular flat, with wave B orange ending between 1,336.95 and 1,338.3 then we may expect wave C orange to reach equality with wave A orange and be about 8.96 points in length.
If wave 4 orange is an expanded flat, the most common type of flat, then wave B orange must be at least 105% the length of wave A orange. This is achieved at 1,338.3. We may then expect wave C orange downwards to be 1.618 the length of wave A orange at 14.5 points.
This possibility allows for a new high beyond the start of wave 4 green at 1,337.85.
Wave 4 green may not move into wave 1 green price territory. This wave count is invalidated with movement below 1,288.88.
Hourly Wave Count – Wave 4 Green As A Triangle
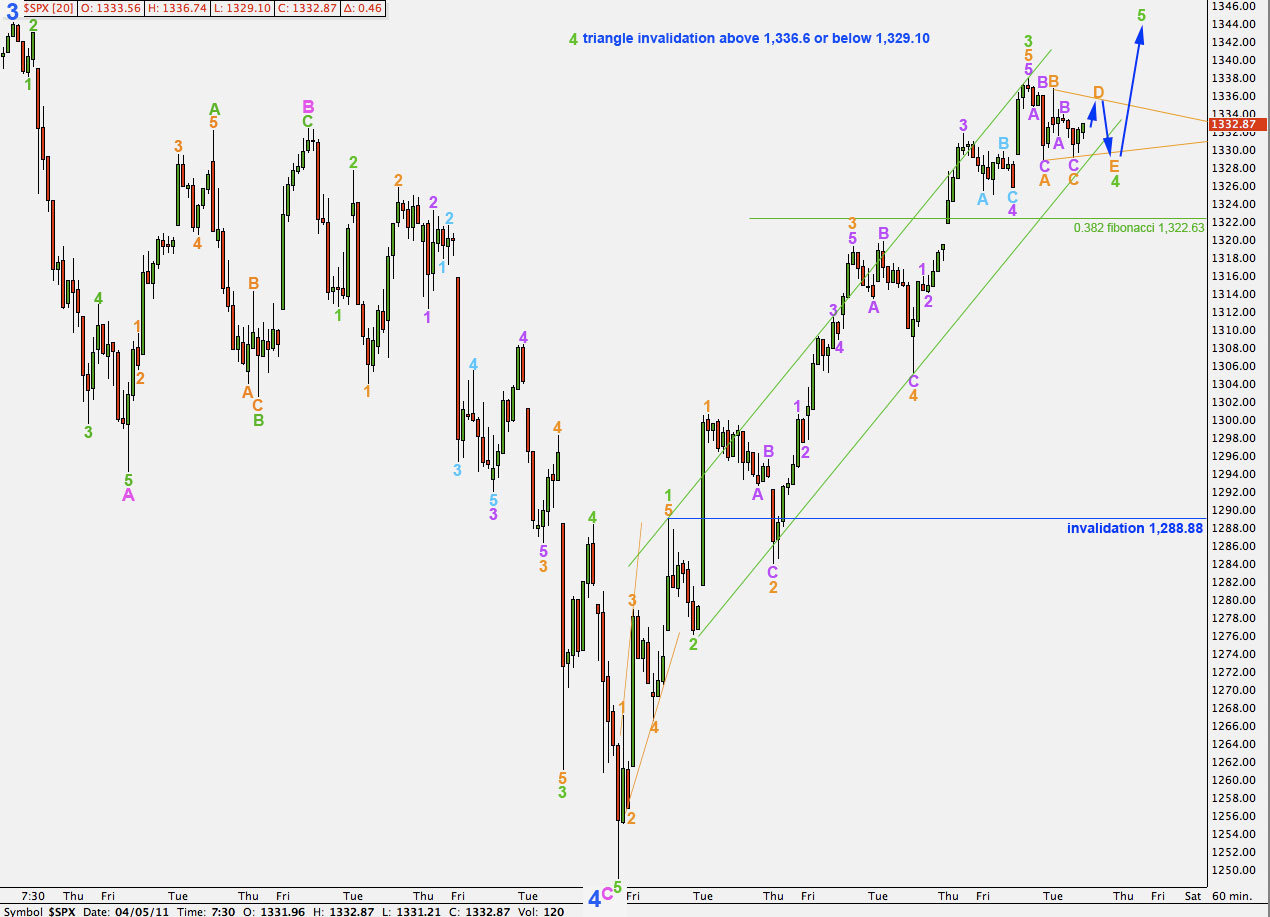
We should expect tomorrow’s session to begin with upwards movement. If this upwards movement does not take price above 1,336.74 then wave 4 green may be unfolding as a triangle.
We should expect one of the subwaves of a triangle to have a 0.618 ratio to its predecessor. At this stage none of the subwaves here exhibit this ratio. Wave D would reach 0.618 the length of wave C at 1,333.82. This is our target for a little more upwards movement to begin tomorrow’s session (or to occur after hours and price may gap open to about this point).
Thereafter, if the triangle remains valid one final wave downwards is required for wave E orange. Wave E may not move beyond the end of wave C orange. The triangle is invalidated with movement below 1,329.1.
If the triangle structure remains valid we have a high probability that the next direction is upwards and is likely to be about 8.96 points in length if it is equal to the widest part o the triangle, or 39.83 if wave 5 green reaches equality with wave 1 green.
At that stage the invalidation point would be very close by at the end of wave C within the triangle at 1,329.10.