
Elliott Wave chart analysis for the SPX500 for 1st April, 2011. Please click on the charts below to enlarge.
Upwards movement as expected has confirmed this main wave count and invalidated the alternate.
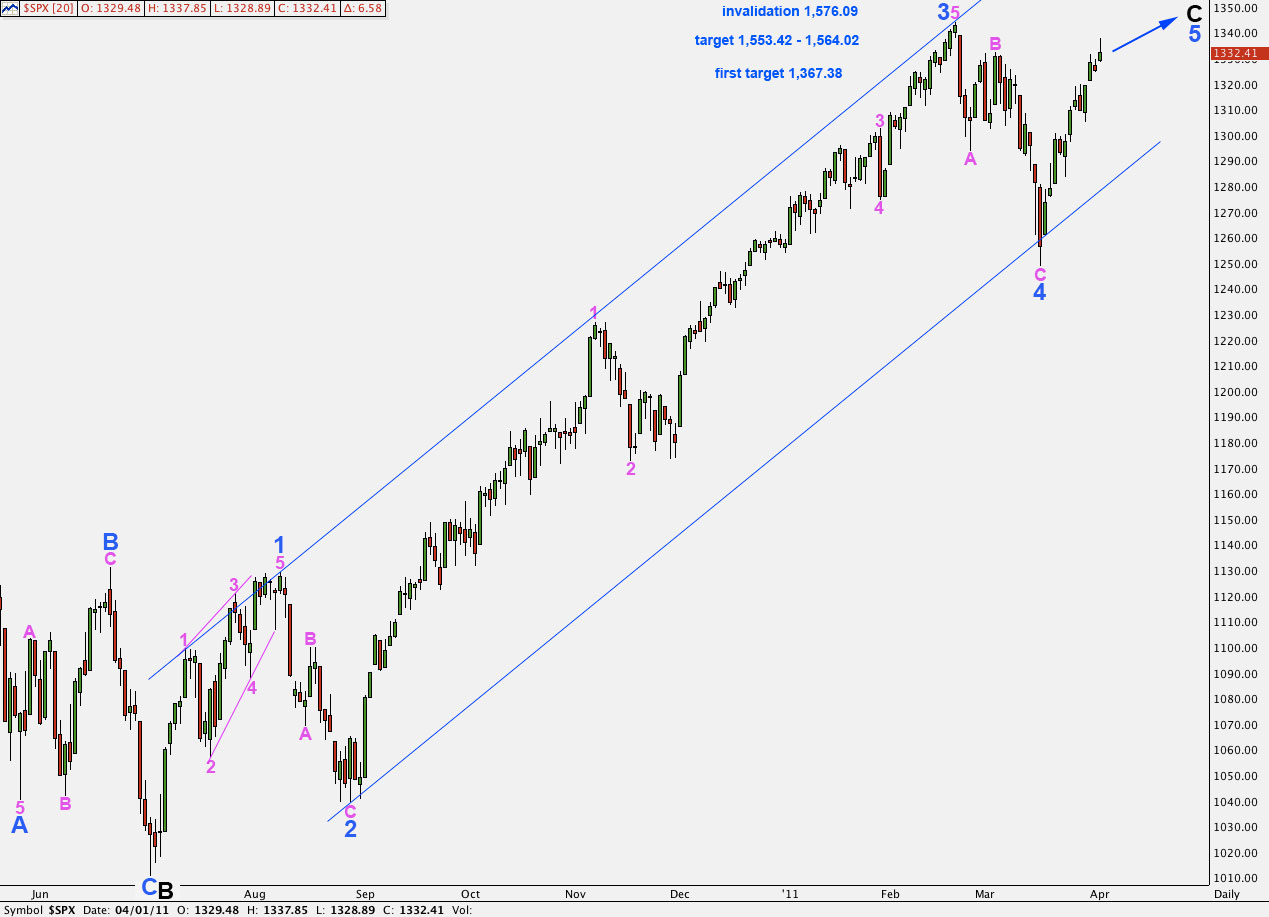
I have calculated a first target for us. At 1,367.38 wave 5 blue will reach equality with wave 1 blue. We would be about halfway through this fifth wave at this stage. About this first target, if there is a satisfactory structure for wave 5 blue, then we must allow for the possibility that primary wave 2 may be over there and we may use an alternate wave count for this.
A more likely target is 1,553.42 to 1,564.02 where wave 5 blue will be close to equality with wave 3 blue and wave C black will be close to equality with wave A black.
This wave count is invalidated with movement above 1,576.09.
If price rises as high as 1,494.16 then there will be the possibility of new all time highs. To understand why please see the alternate wave count at the end of the historic analysis.
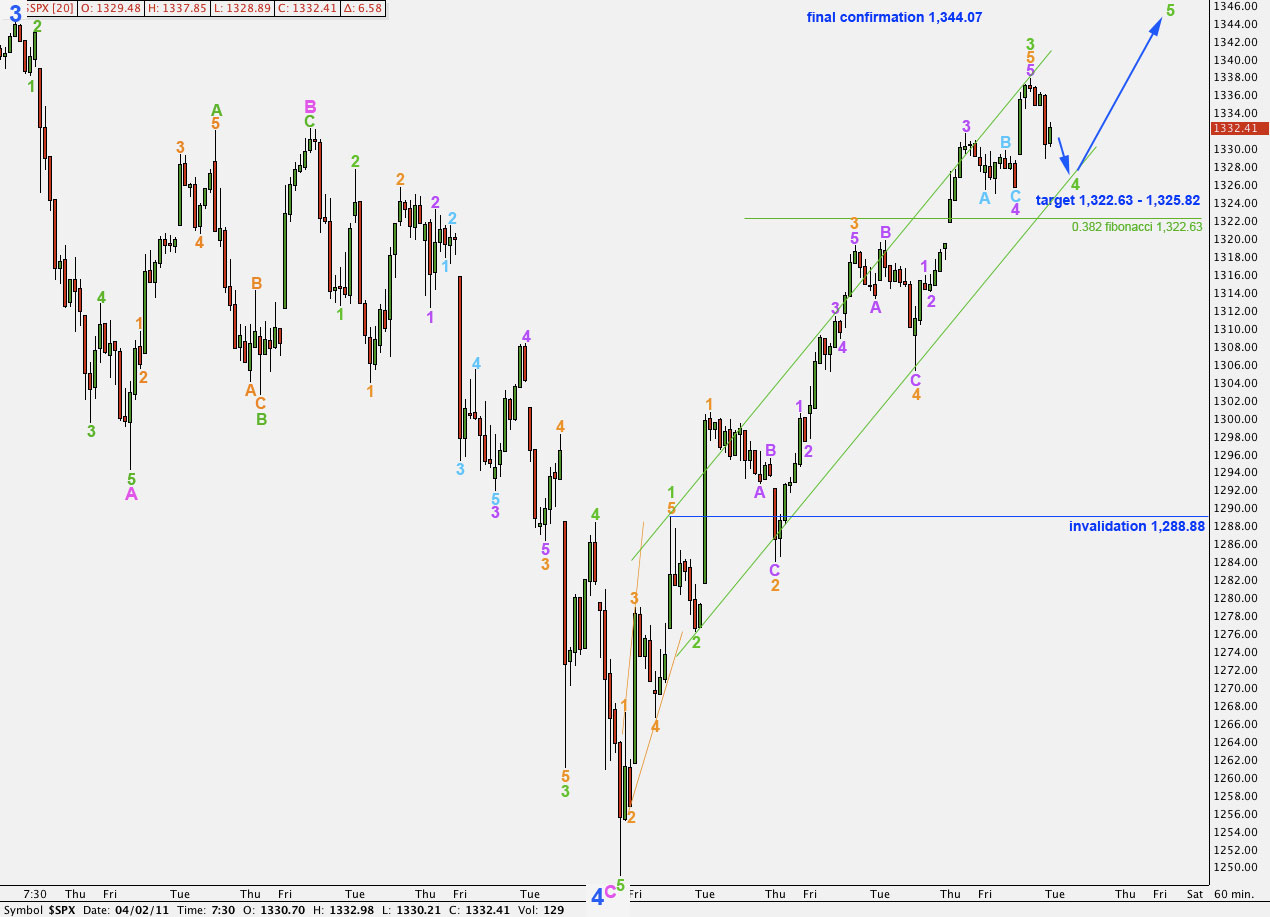
We had expected wave C aqua within wave 4 purple to take price a little lower before upwards movement for wave 5 purple. This did not happen and this C wave is truncated.
The target for upwards movement was 1,339.49 to 1,340.39. Upwards movement ended 1.64 points short of the target at 1.337.85.
Wave 3 green is 2.77 points short of 1.618 the length of wave 1 green.
Ratios within wave 3 green are: wave 3 orange is 4.35 points short of 1.618 the length of wave 1 orange and wave 5 orange is 2.54 points short of equality with wave 3 orange.
Ratios within wave 5 orange of wave 3 green are: wave 3 purple is 1.85 points longer than 1.618 the length of wave 1 purple and wave 5 purple is 1.16 points short of 0.618 the length of wave 3 purple.
Wave 4 green may end about the lower edge of the green channel, drawn here around upwards movement, or it may overshoot the channel.
Wave 4 green may end about a target of 1,325.82 to 1,322.63 which is the fourth wave of one lesser degree and the 0.382 fibonacci ratio of wave 3 green. Wave 2 green was a zigzag so it is likely that wave 4 green will be either a flat or a triangle.
Alternate Daily Wave Count.
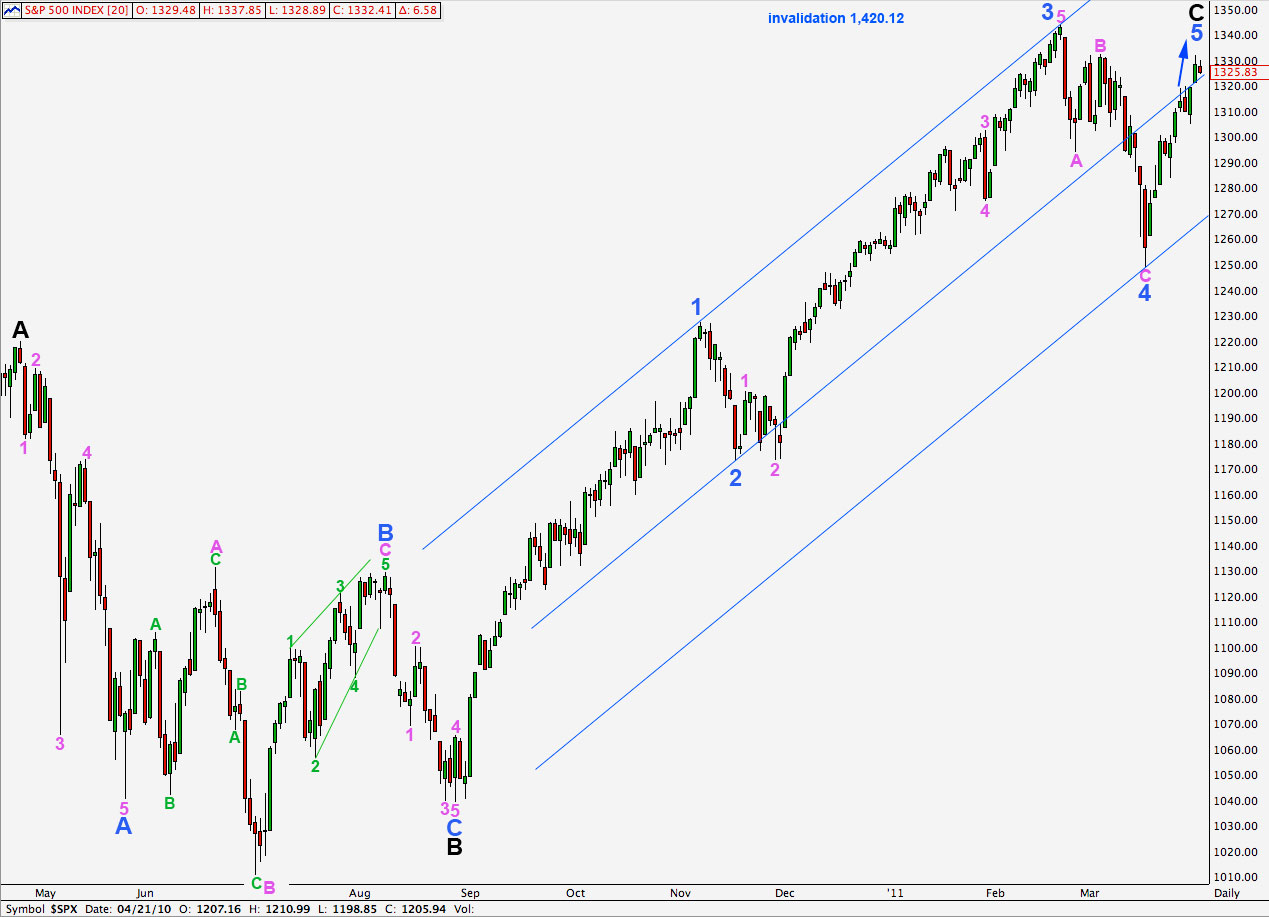
I will present this wave count today only and thereafter will upload it to the historic analysis as another alternate.
It also sees the S&P as in the final fifth wave upwards of wave C black to end primary wave 2 zigzag.
Wave 3 blue here is slightly shorter than wave 1 blue by 16.31 points.
This wave count has a truncation within it for wave C pink within wave B blue.
The ratio between waves 1 and 3 blue within wave C black is not as good as our main wave count.
For these two reasons this wave count is possible but has a slightly lower probability than our main wave count.
This wave count does however resolve the problem of wave 3 blue looking like a three on the daily chart for our main wave count.
Within wave B black waves A and C blue have no fibonacci ratio between them.
Within wave B blue waves A and C pink have no fibonacci ratio between them.