
Elliott Wave chart analysis for the SPX500 for 29th March, 2011. Please click on the charts below to enlarge.
Main Wave Count.
We did not see the upwards movement we were expecting for Tuesday, but price remains slightly higher than the close of Monday.
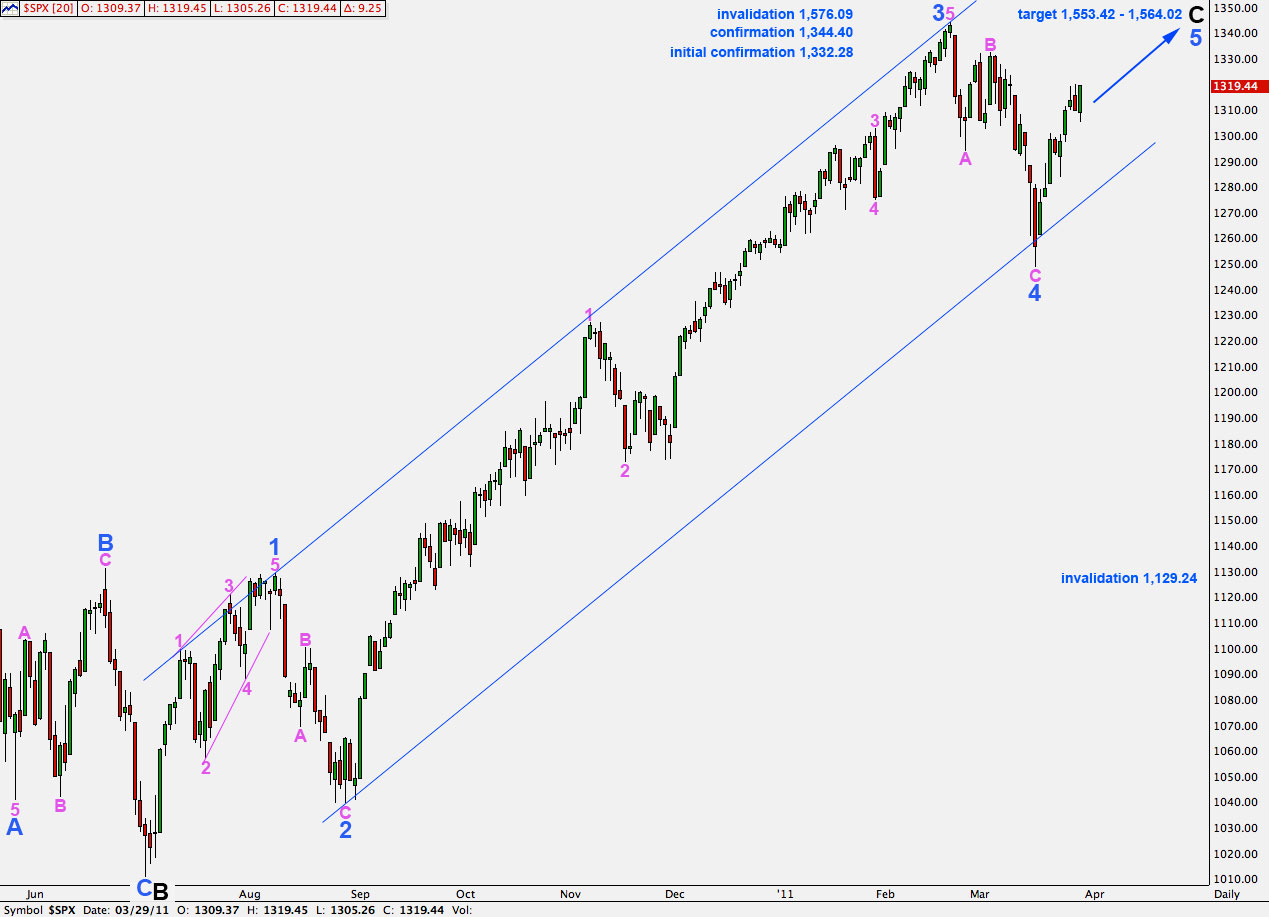
This wave count expects there there is a long way upwards to go before primary wave 2 is over. At 1,553.42 wave 5 blue will reach equality with wave 3 blue. At 1,564.02 wave C black will reach equality with wave A black.
This wave count expects no new all time highs for the S&P above 1,576.09.
Movement above 1,332.28 will invalidate our main wave count and confirm this main wave count.
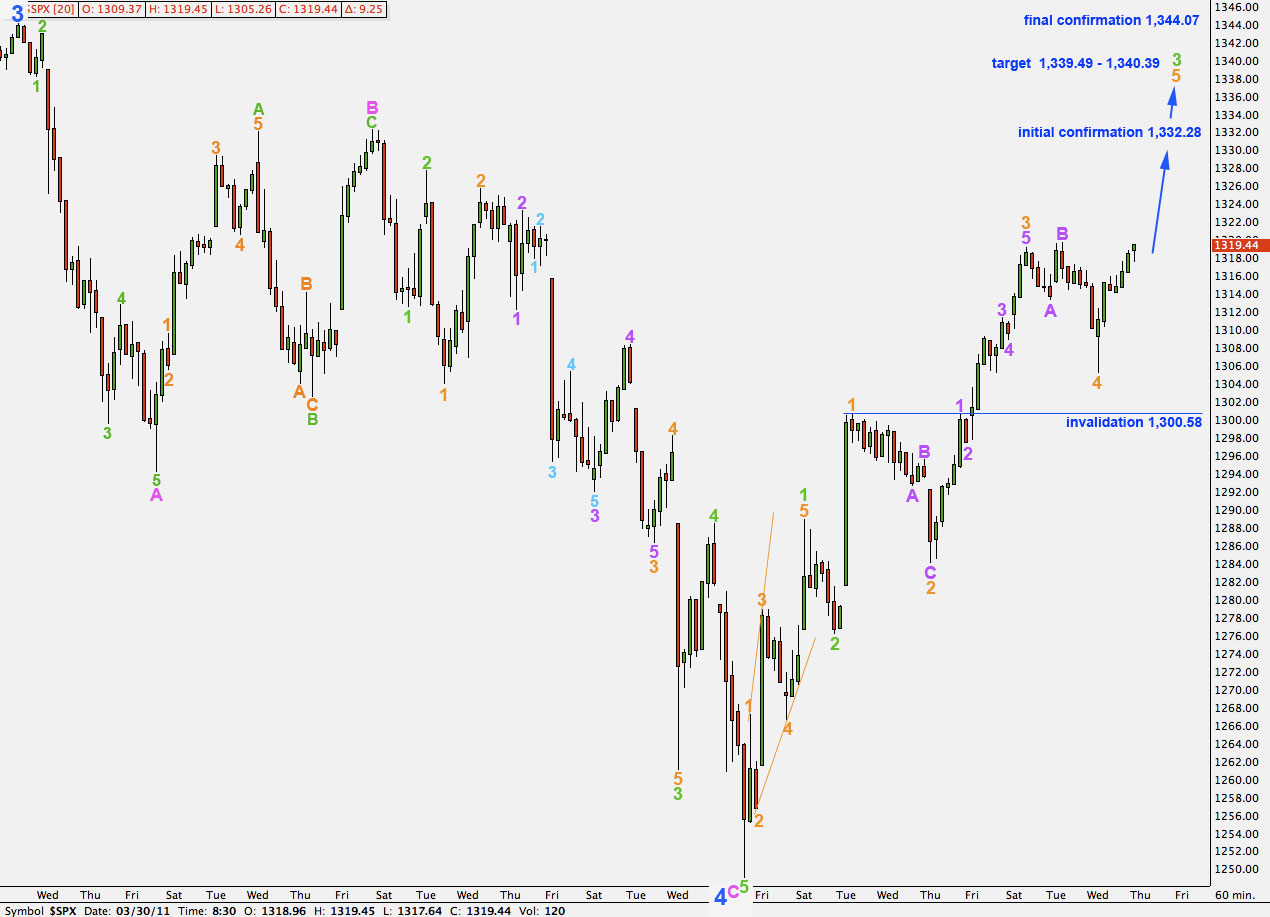
Downwards movement was a further extension of wave 4 orange. Within wave 4 orange wave C purple is now 0.38 short of 2.618 the length of wave A purple.
This wave count expects further upwards movement overall for the next few days.
At 1,339.49 wave 3 green will reach 1.618 the length of wave 1 green.
At 1,340.39 wave 5 orange to end wave 3 green will reach equality with wave 3 orange.
Any further extension of wave 4 orange if it continues as a double flat or double combination may not move into wave 1 orange price territory. This wave count is invalidated with movement below 1,300.58.
Alternate Wave Count.
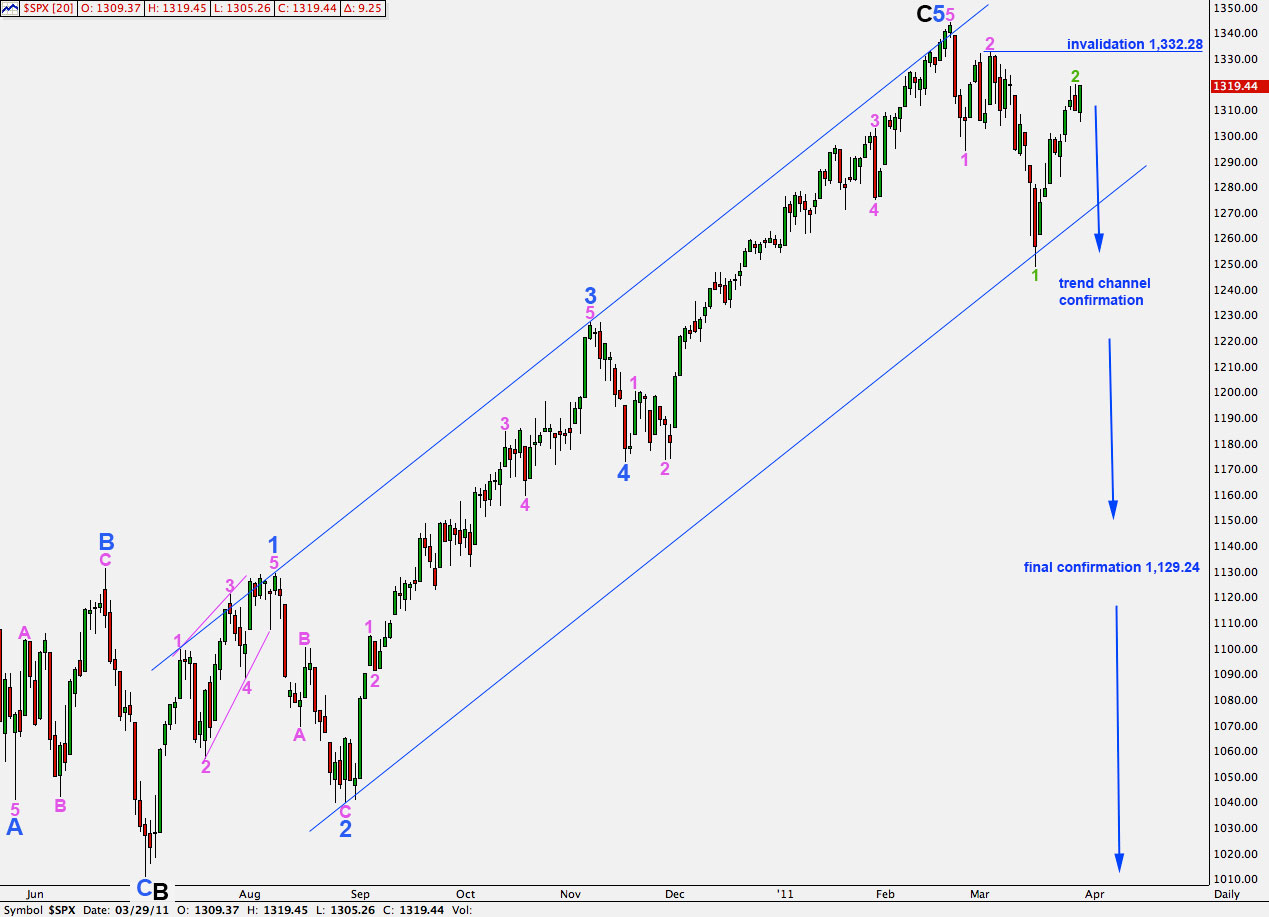
This wave count remains technically valid for the S&P500. However, for the Dow and Russell 2000 the counts were invalidated by upwards movement.
This wave count now has a very low probability but it remains technically impossible.
Movement above 1,332.28 may be considered invalidation of this wave count.
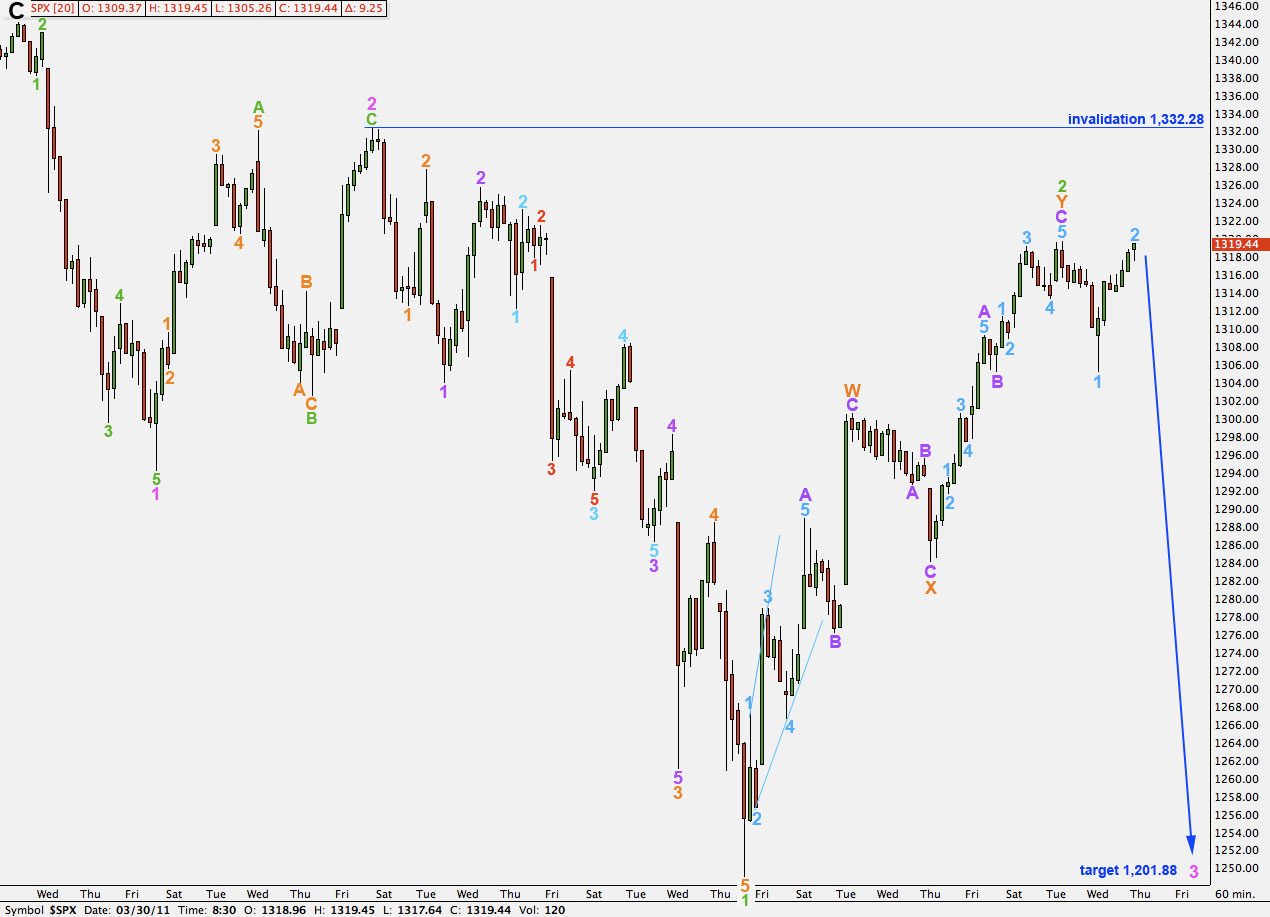
Any further upwards movement for wave 2 green may not move beyond the start of wave 1 green. This wave count is invalidated with movement above 1,332.28.