
Elliott Wave chart analysis for the SPX500 for 24th March, 2011. Please click on the charts below to enlarge.
Main Wave Count.
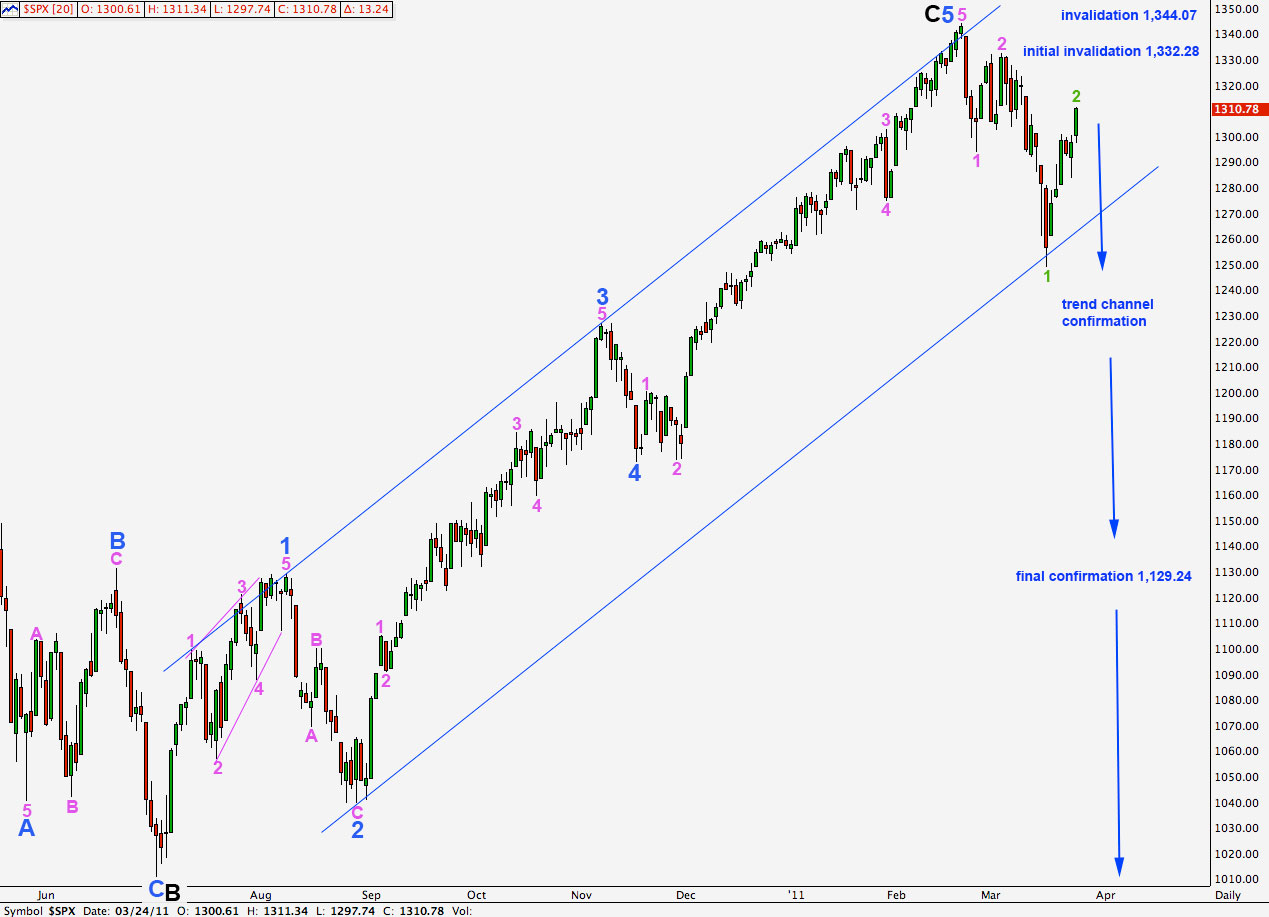
Recent wave behaviour does not support this wave count. However, it remains valid and only movement above 1,332.28 would invalidate it.
This wave count still has the best look on the daily and weekly charts. We require confirmation of this big trend change with movement below the blue parallel channel here on the daily chart.
Until we have confirmation of a trend change using Elliott’s channeling technique we must admit the possibility of new highs.
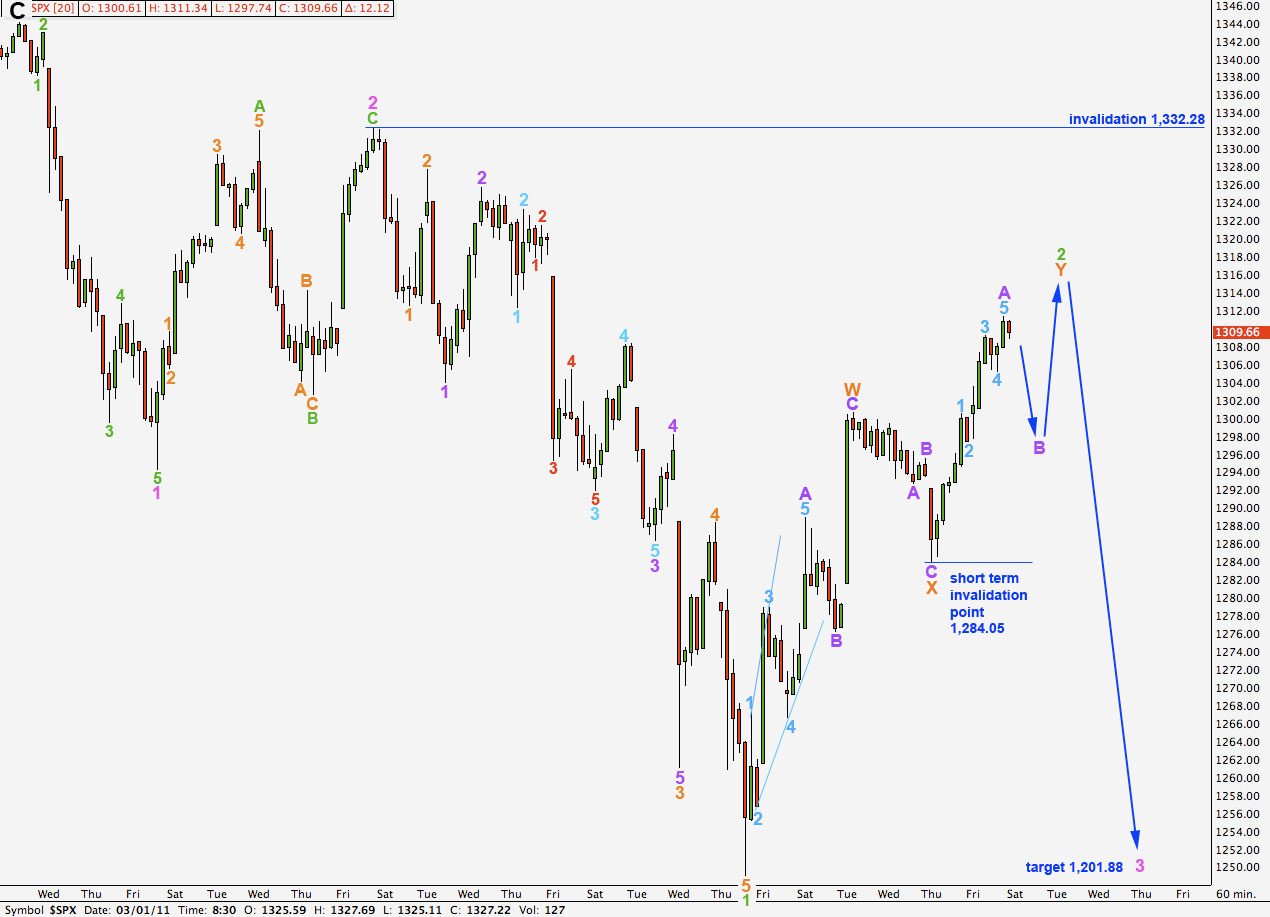
Upwards movement is again in a clear five wave structure.
Wave 2 green is here labeled as a double zigzag. The second zigzag, wave Y orange, is incomplete. Wave B purple may not move beyond the start of wave A purple so we should see a little downwards movement for this B wave which may not move below 1,284.05.
The only situation which I can see where wave Y orange could continue with movement below 1,284.05 is a running triangle. This has a much lower probability than wave Y orange being a simple zigzag.
Wave 2 green has passed the 0.618 fibonacci ratio of wave 1 green. This is a very deep correction.
Wave 2 green may not move beyond the start of wave 1 green above 1,332.28.
Alternate Wave Count.
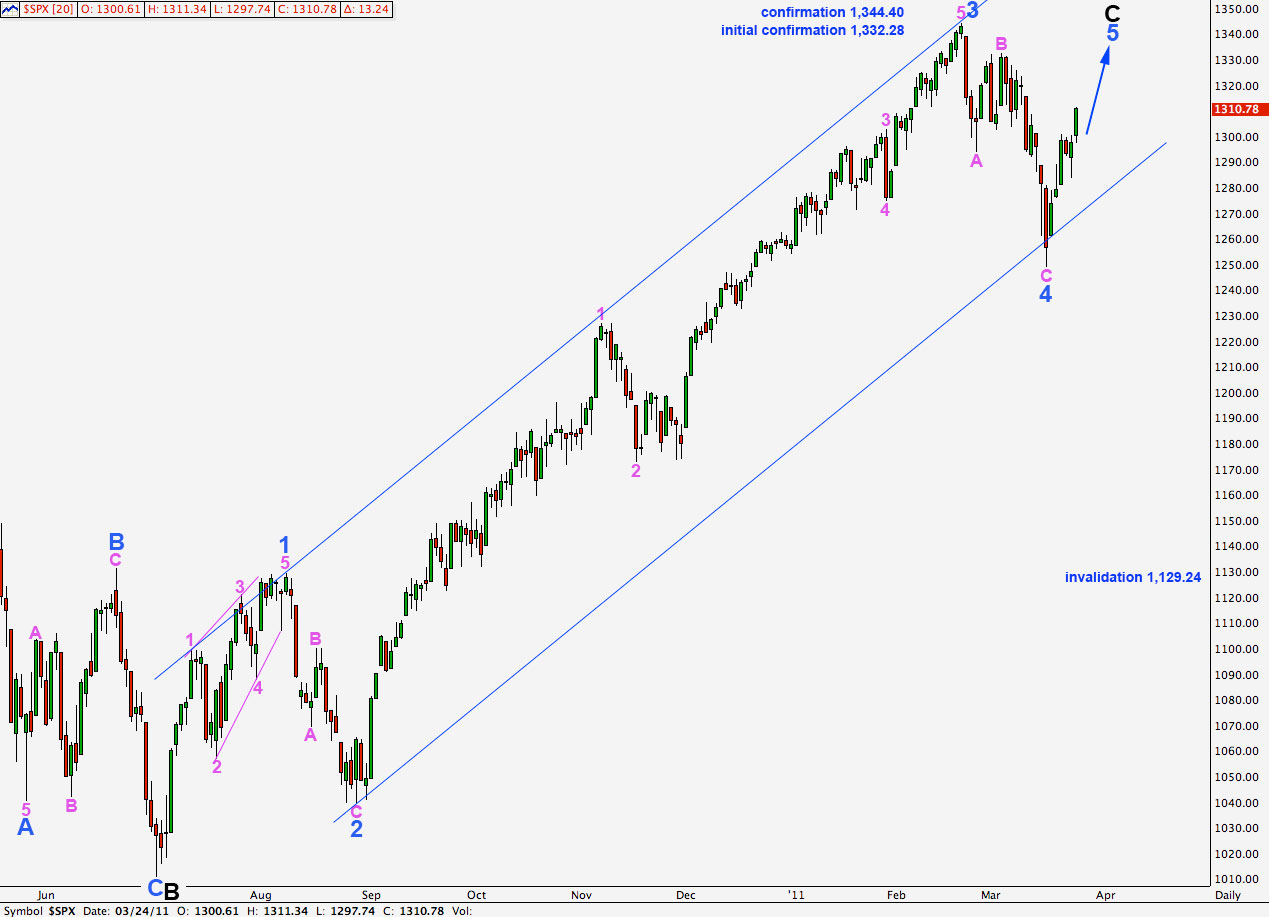
Recent wave behaviour is what we would expect for this wave count.
My main objection to this wave count remains the overall three look to wave 3 blue. It should look more clearly like a five on the daily chart.
Movement above 1,332.28 would provide initial confirmation of this wave count and would give us quite a lot of confidence that we shall see new highs for the S&P.
Movement below 1,249.05 would invalidate this wave count. At that stage we would also start to see movement below the lower edge of the parallel channel, again, and this wave count would not have the right look at all.
Movement below 1,129.24 would provide final technical invalidation of this wave count. At that stage we may be very confident that downwards movement would be primary wave 3 down and the S&P would fall to new lows.
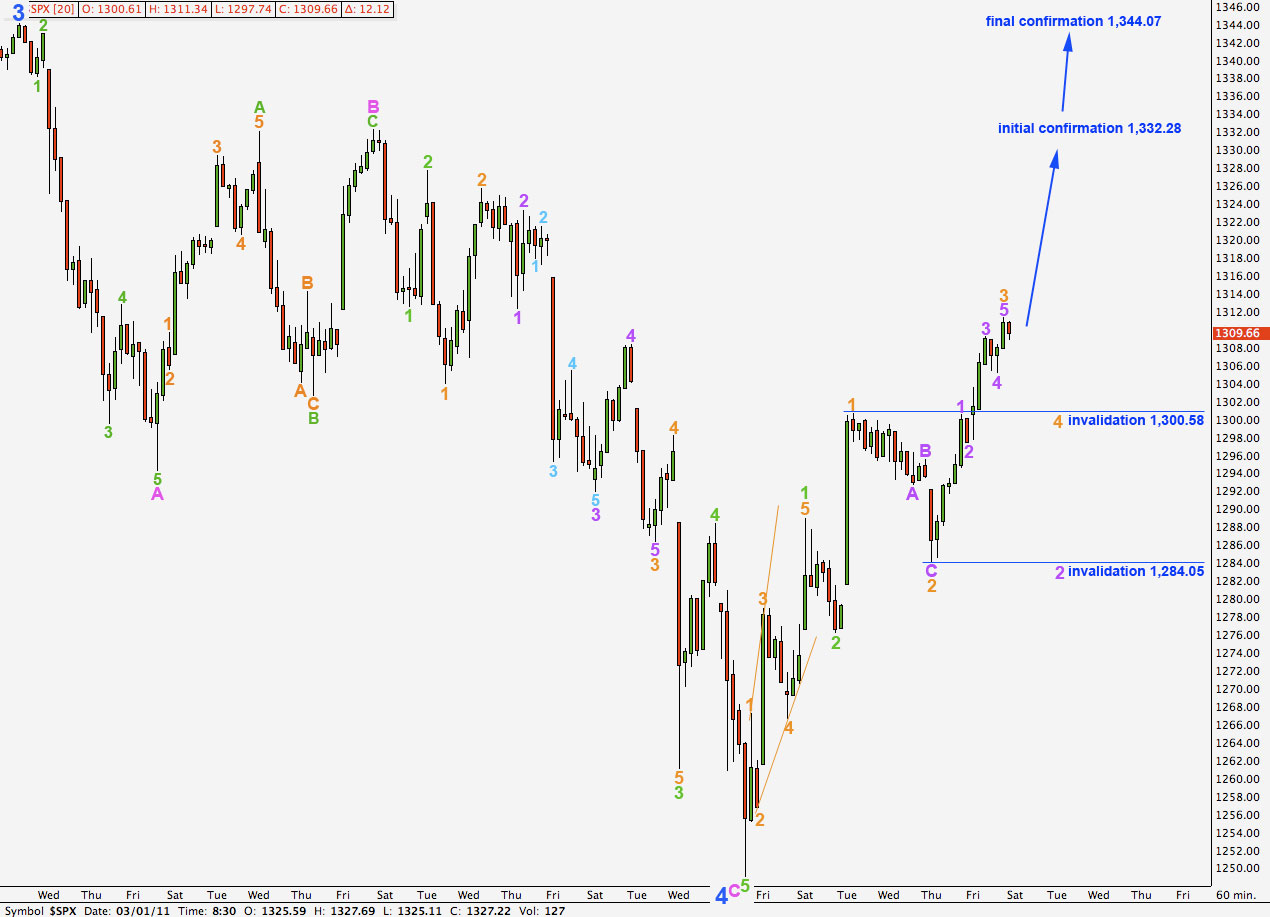
Recent upwards movement is what we would expect to see for this alternate wave count.
Wave 1 green is a leading expanding diagonal.
Within wave 3 green we may have the end to 1-2-3 orange. Wave 3 orange is just 2.89 points longer than wave 1 orange.
Ratios within wave 3 orange are: wave 3 purple is 1.6 points longer than 0.618 the length of wave 1 purple and wave 5 purple is just 0.19 points short of 0.382 the length of wave 1 purple.
Wave 4 orange may not move into wave 1 orange price territory below 1,300.58.
Wave 3 orange may also be labeled as only wave 1 purple within wave 3. If this is the case we may be seeing an extended wave 3 develop. Wave 2 purple may not move beyond the start of wave 1 below 1,284.05.
At this stage movement below 1,284.05 would invalidate this wave count.