
Elliott Wave chart analysis for the SPX500 for 23rd March, 2011. Please click on the charts below to enlarge.
Main Wave Count.
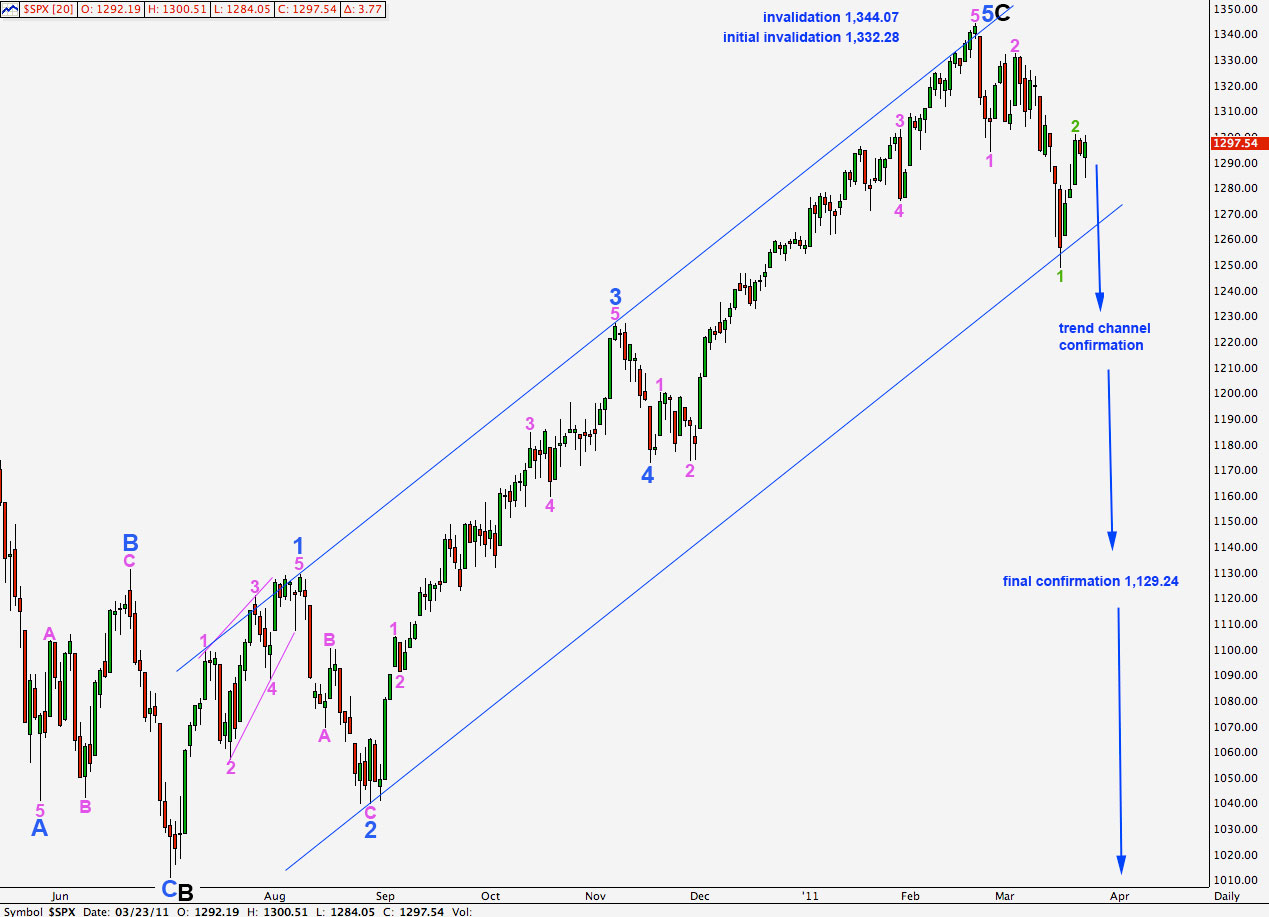
We were expecting the S&P 500 to break out of the narrow range in which it was trading to provide us with some clarity, but this was not to be.
Both wave counts remain valid today.
Movement below 1,276.18 will be our first indication that this wave count is correct. Movement below the parallel channel on the daily chart will provide us with trend channel confirmation of this big trend change.
Primary wave 3 must take price comfortably below 666.79 so there would still be a very long way down to go after we have confirmation of a trend change.

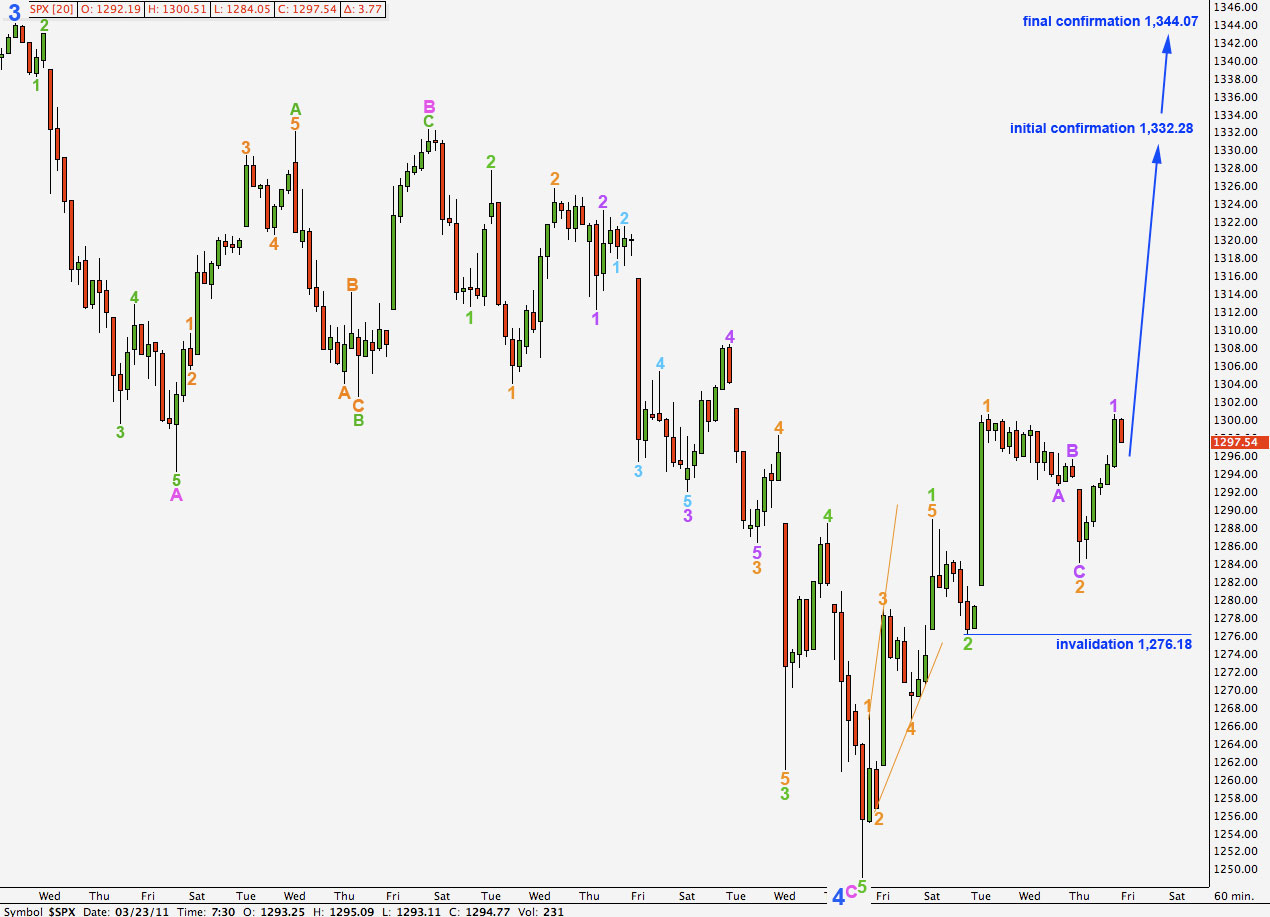
Upwards movement labeled here A purple. of wave Y orange, has an impulsive count of 9 on the 15 minute chart so it may not be a B wave.
Wave 2 green is most likely extending sideways and upwards as a double combination or a double zigzag. This second structure labeled wave Y orange is most likely to be a zigzag but it may also unfold as a triangle.
If the second structure is a zigzag then wave B purple may not move beyond the start of wave A purple. This structure would be invalid with price movement below 1,284.05.
If, however, this second structure is a triangle (much less likely) then wave B purple may actually end beyond the start of wave A as for a running triangle. The is a low probability.
Wave 2 green requires at least two more small waves. It may not move beyond the start of wave 1 green. Movement above 1,332.28 would invalidate this wave count. At that stage we would use the alternate wave count below.
The short term target at 1,217.35 is where wave 3 green will reach equality with wave 1 green.
Alternate Wave Count.
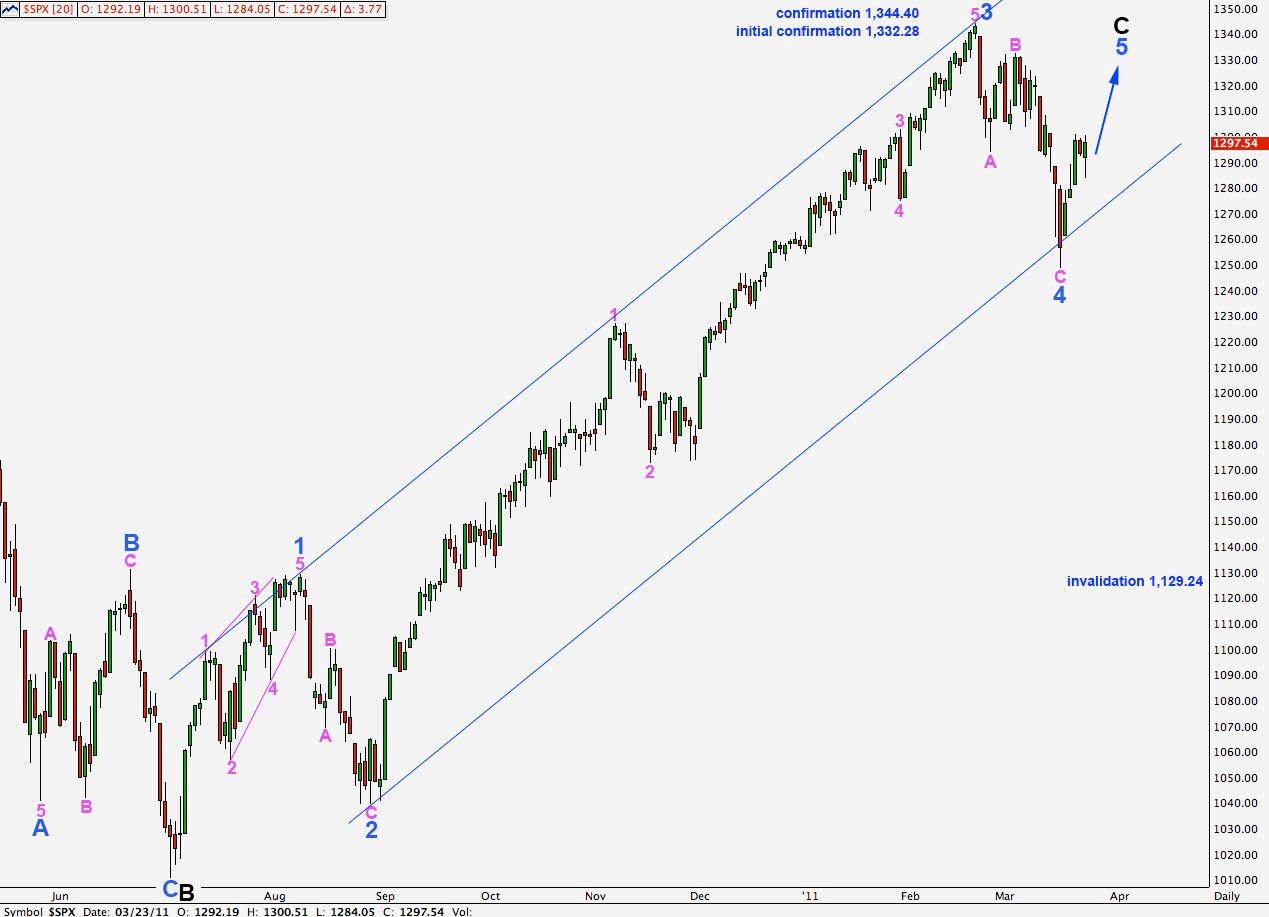
This wave count expects new highs for the S&P 500. If we see movement above 1,332.28 then we may use this wave count with some confidence.
Movement below 1,276.18 initially, and especially movement below 1,249.05 to a new low and back outside the parallel channel, would all but eliminate this wave count. At that stage it would remain technically correct but it would not have the right look.
A trend channel breach (not just an overshoot) with at least one full candlestick outside the channel may be considered adequate confirmation of a trend change.
Movement below 1,129.94 would provide final technical invalidation of this wave count, but it would look so strange before that point that we would not consider it.
We need to see movement above 1,332.28 before we can expect to see new highs for the S&P 500.
I have left the invalidation point on the hourly chart at 1,276.18 because it is possible that wave 2 orange may yet extend sideways and a little lower as a double zigzag or combination. Any extension of wave 2 orange may not move beyond the start of wave 1 orange.
Recent upwards movement has a nice count of 9, impulsive, on the 15 minute chart so I have labeled it a 1 (purple) for this interpretation. In the short term movement below 1,284.05 should not be expected prior to a new high above 1,300.51. Wave 2 purple may not move beyond the start of wave 1 purple.
If wave 2 orange is not over and extends further as a double or combination then upwards movement may be wave A of a zigzag for an X wave. We would need to see B-C develop higher before a second structure downwards which may at that stage move below 1,300.51 but not below 1,276.18.