
Elliott Wave chart analysis for the SPX500 for 22nd March, 2011. Please click on the charts below to enlarge.
I will publish weekly charts with this analysis today and then I’ll update the historical analysis, with ratio analysis, as soon as I have time.
Main Wave Count.
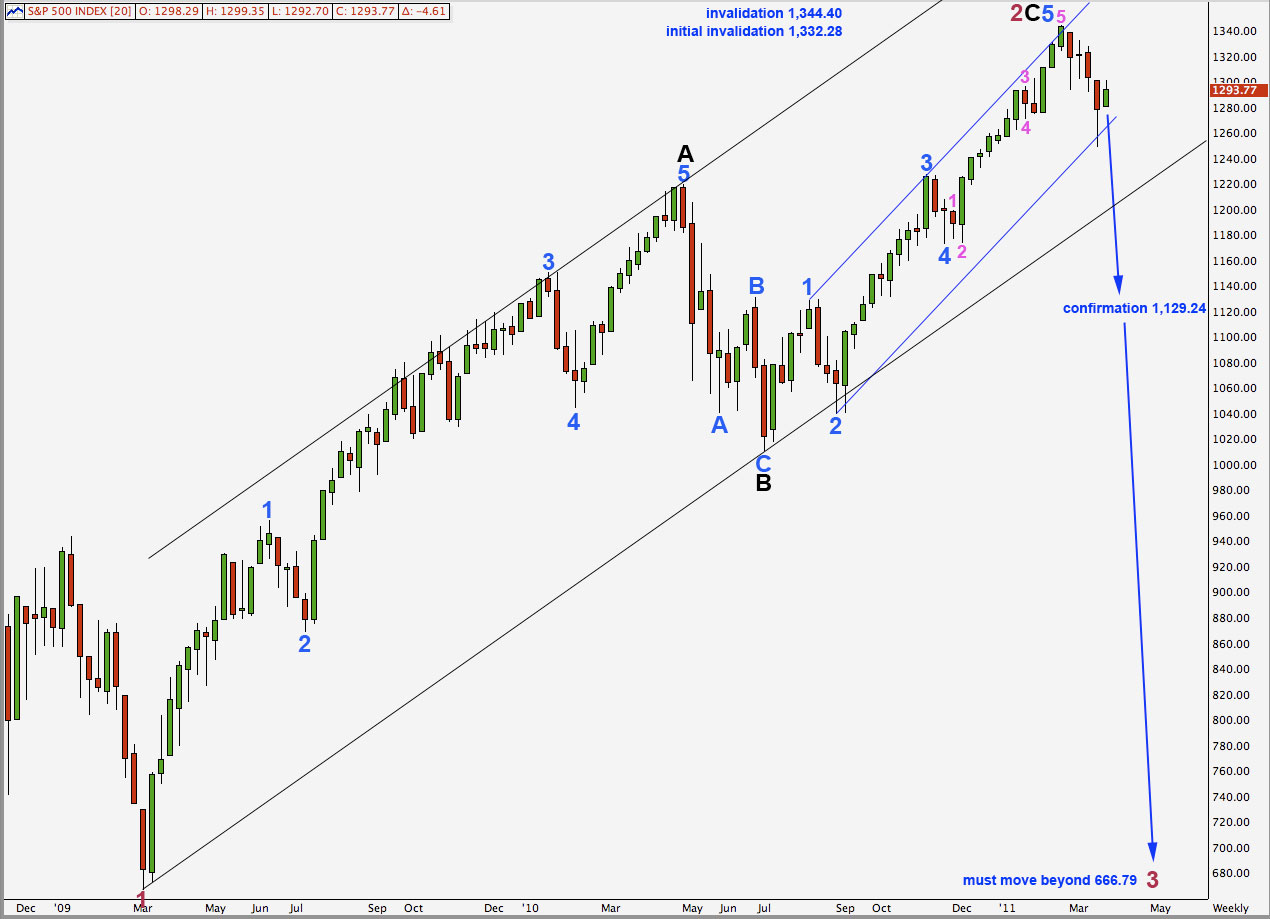
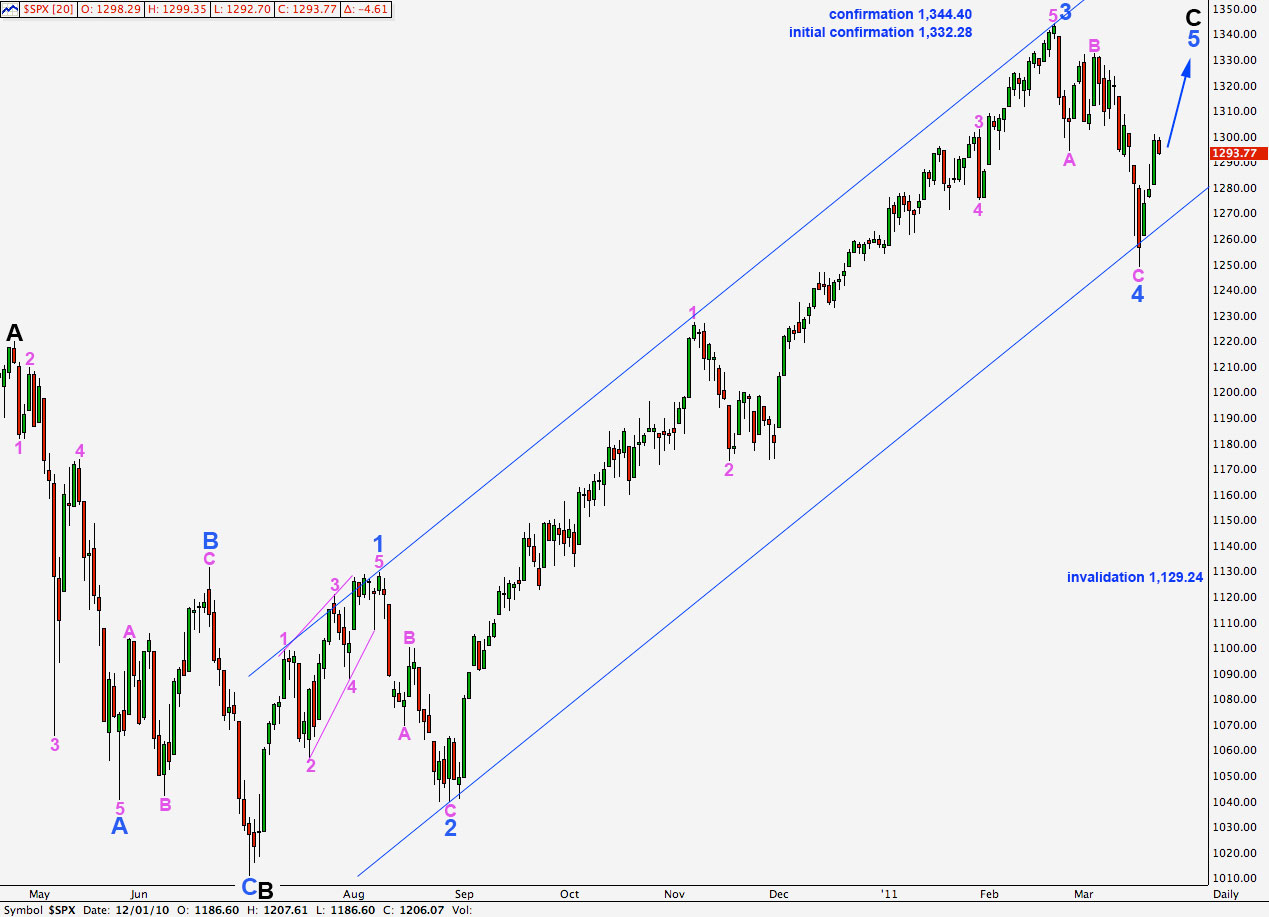
This main wave count has a better fit on the weekly chart. A cursory count of intermediate wave C yields a count of 9 (I will outline this in the video). This is impulsive. Wave C black and primary wave 2 could be over here.
The wide black channel is Elliott’s technique for a correction. When we see a weekly candlestick below this channel we will have confirmation of a trend change at primary degree.
Primary wave 3 must move beyond the end of primary wave 1 below 666.79.
Very slow slightly downwards movement has not really illuminated the current situation much. It may be considered to have a better fit with the alternate wave count, but it is not decisive evidence.
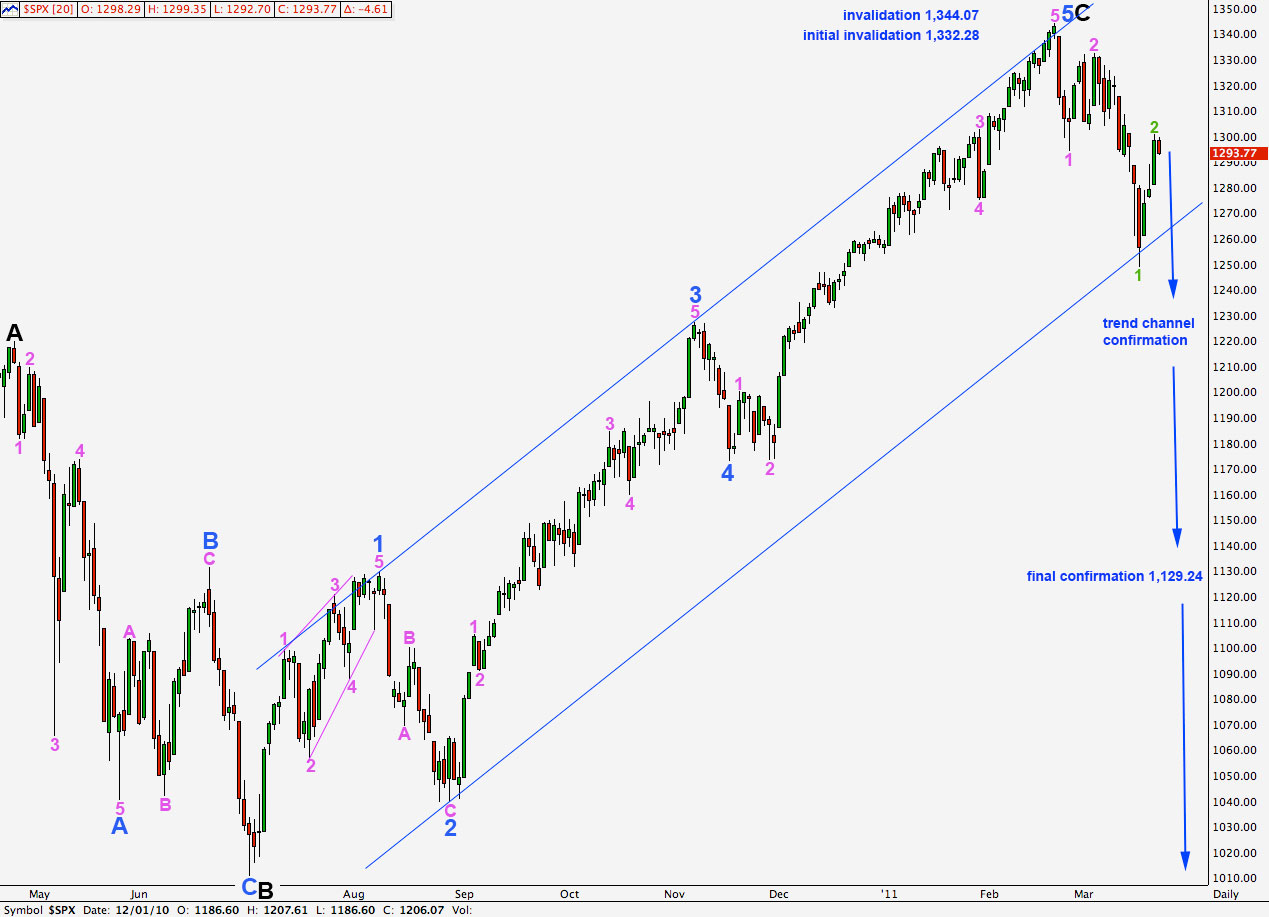
This wave count expects that primary wave 3 has begun. However, we do not have confirmation of this big trend change. We should use the wide blue parallel channel, as Elliott intended, and wait for confirmation of this by a channel breach before being confident of a high in place.
Movement above 1,332.28 will make this wave count look very unlikely. Movement above 1,344.07 will finally invalidate it.
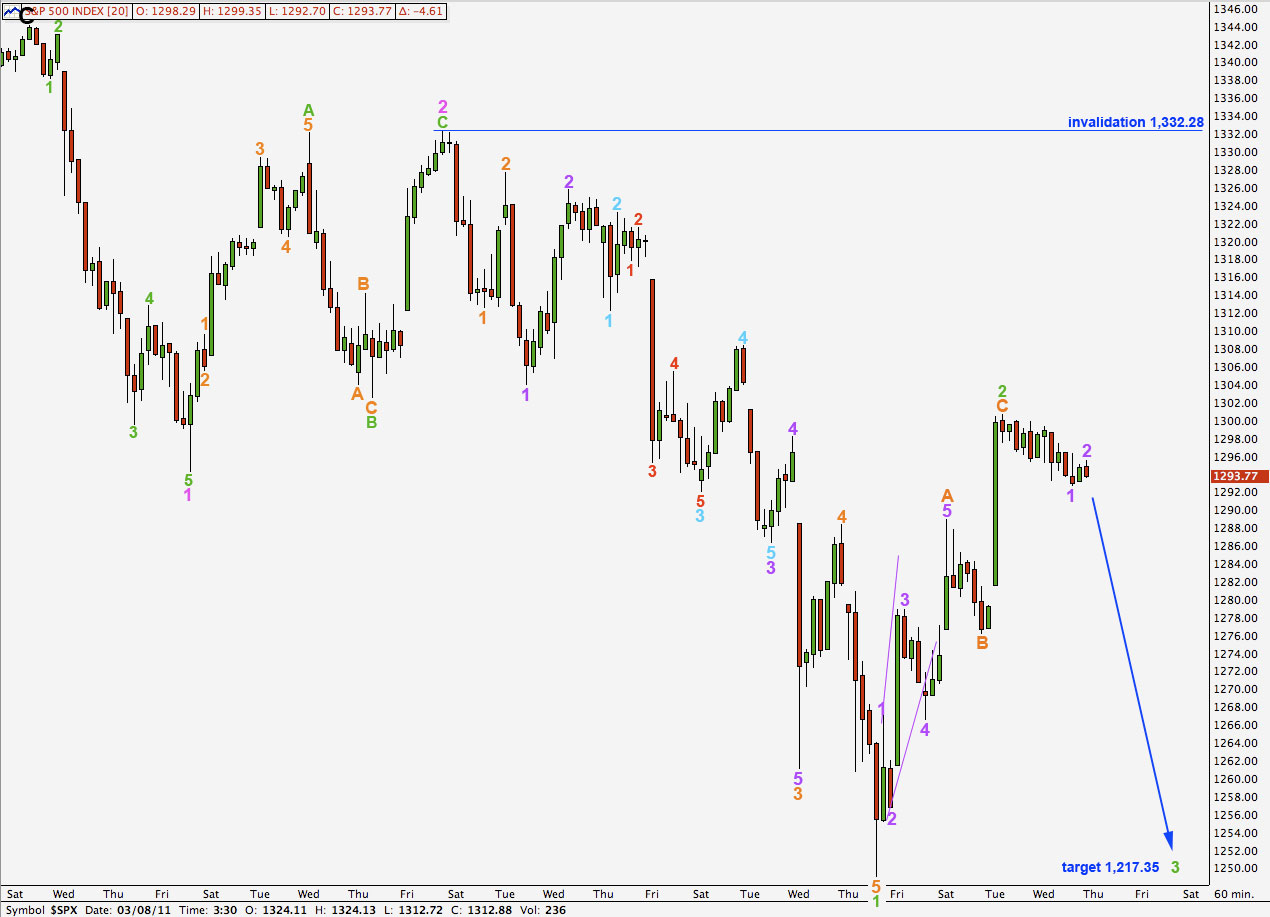
Today’s downwards movement has an impulsive count of 9. It would most likely be a leading diagonal, labeled here 1 purple.
The movement, however, for the start of a third of a third wave is not convincing in its behaviour. We should expect explosive downwards movement at this time.
Wave 2 green may yet extend higher as a double zigzag or combination. If it does it may not move beyond the start of wave 1 green above 1,332.28. At that stage it is difficult to see a bearish wave count so we would all but eliminate this possibility.
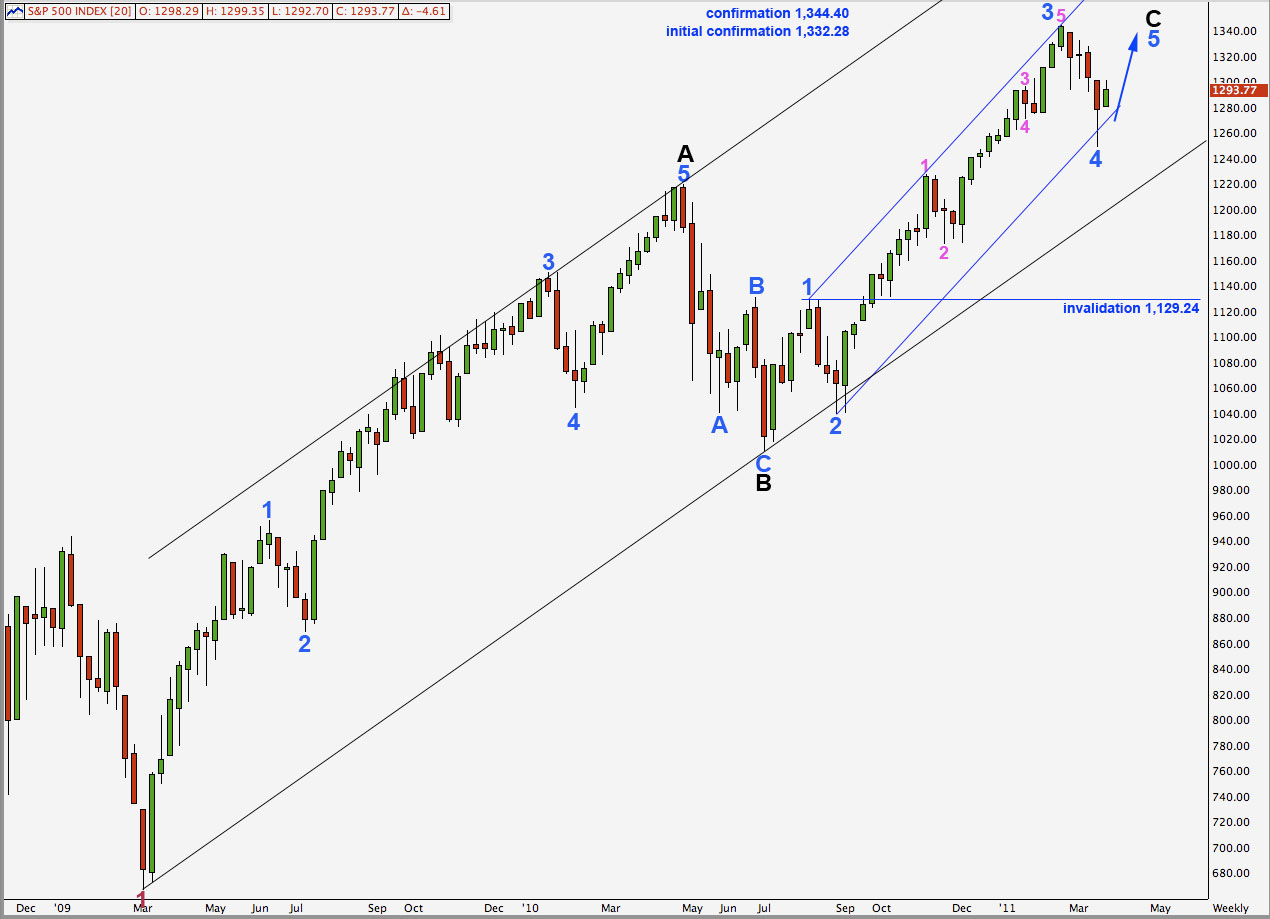
Alternate Wave Count.
If we count the downwards wave labeled here 4 pink within 3 blue as part of the 9 waves movement, then surely we should also count that longer downwards wave just after 2 pink within 3 blue, as we have for the main wave count. On the weekly and daily charts this wave count has a slightly unsatisfactory look.
On the daily chart this third wave at blue degree looks like a three.
Significant movement below either of the parallel channels around primary 2 or black C would put this wave count into extreme doubt.
If this wave count is correct then we would expect to see slow and steady upwards movement as a final fifth wave at minor degree unfolds. Downward movement would be well supported by the lower edge of the blue parallel channel drawn here.
We need to see movement above 1,332.28 to have confidence in this wave count. At that stage we should expect new highs from the S&P are most likely.
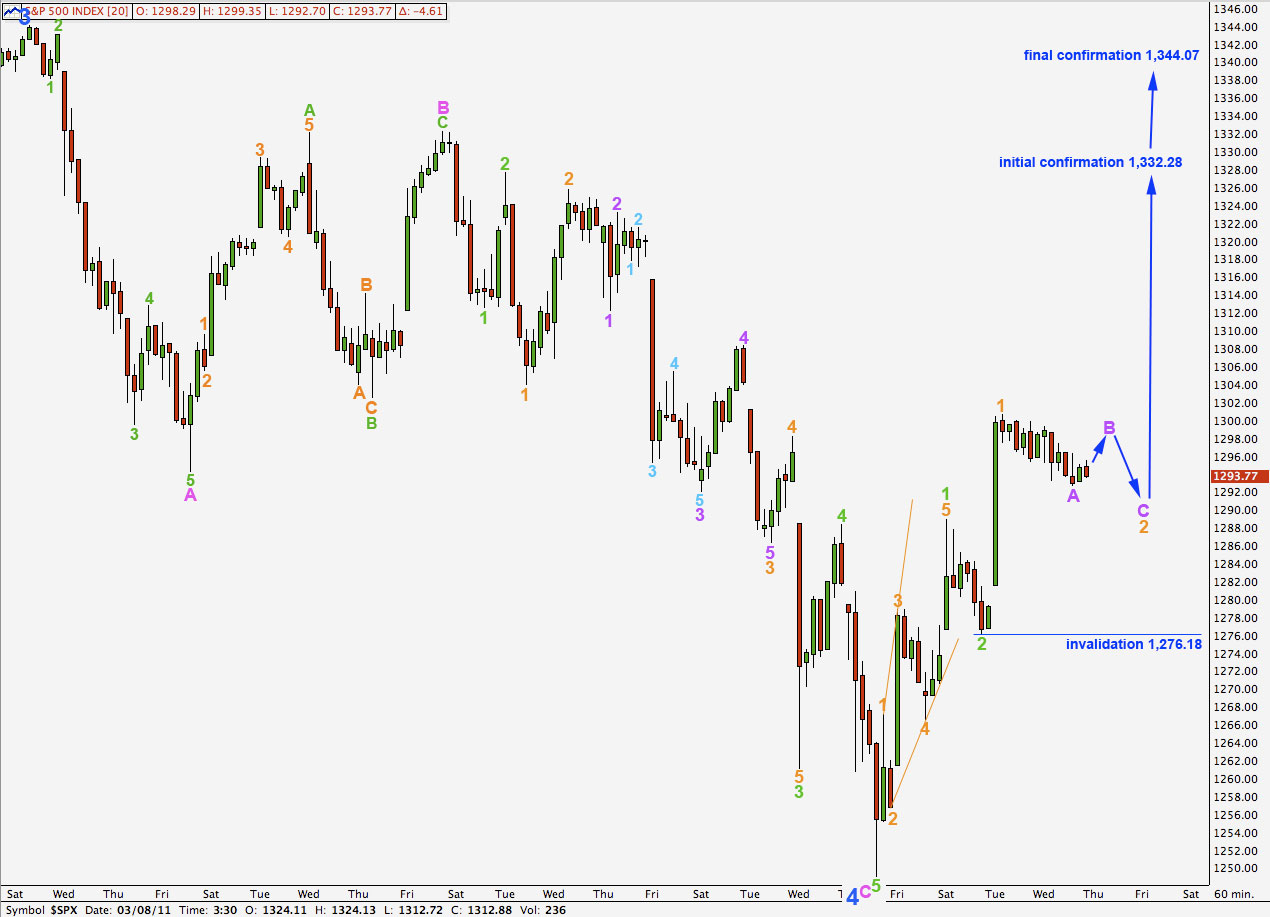
Yesterday’s slow movement is exactly what we should expect from this wave count. Wave behaviour of yesterday’s session does fit nicely.
The downwards movement has a count of 9 so is most likely only wave A purple within a second wave correction. This needs to form another 2 waves to be corrective before we see upwards movement if this wave count is correct.
Movement below 1,276.18 at this stage would leave this upwards movement a clear three wave structure. At that stage this wave count will not have the right look on the hourly chart.
Movement below 1,249.05 would further invalidate this wave count and take price back outside the trend channel on the daily chart.