
Elliott Wave chart analysis for the S&P 500 Index for 21st March, 2011. Please click on the charts below to enlarge.
Main Wave Count.
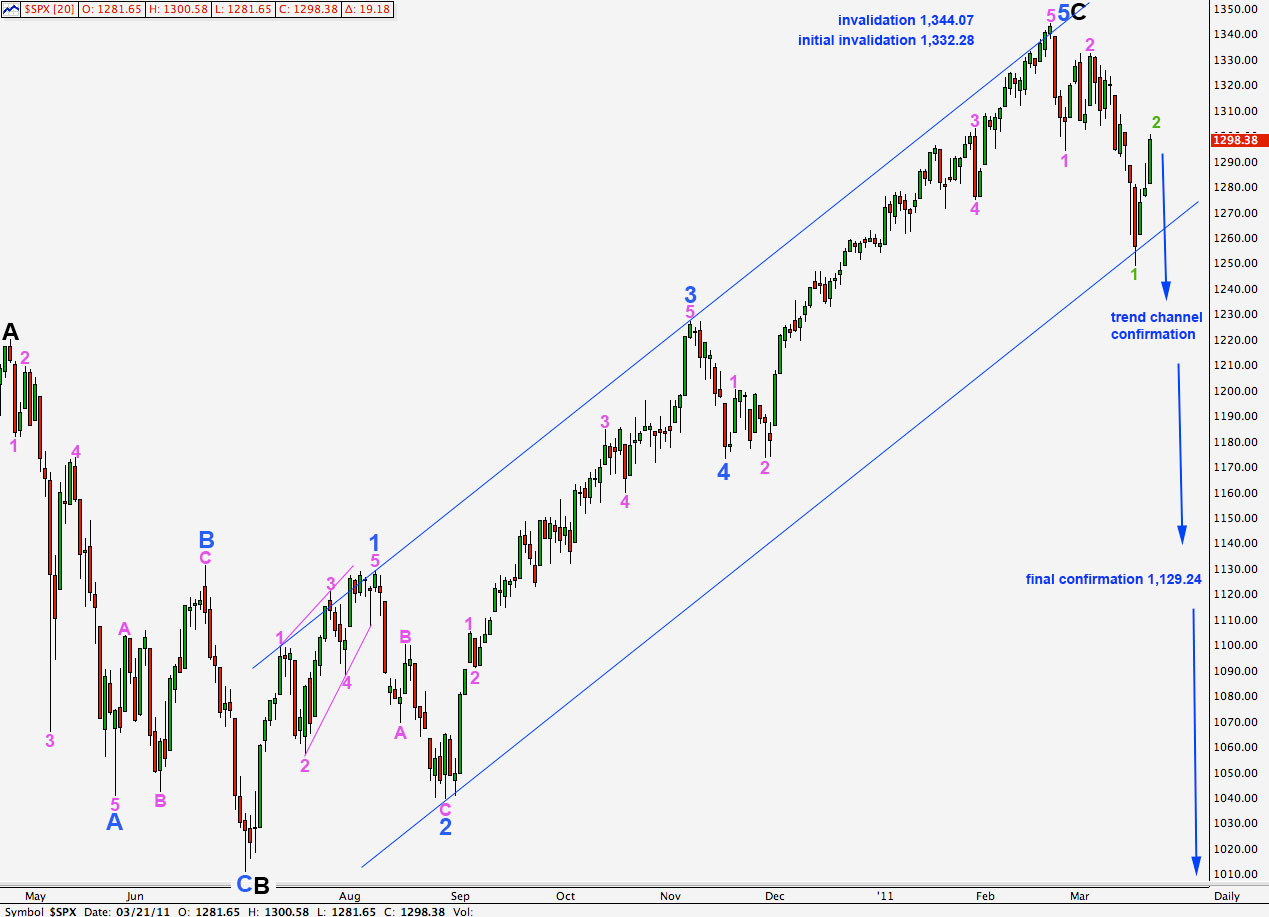
This wave count sees the S&P 500 as within a primary third wave down within a cycle degree C wave of an expanded flat correction.
If this wave count is correct then primary wave 3 must move beyond the end of primary wave 1 which has its low at 666.79. There is a long way down to go.
The wide blue parallel channel is drawn around the impulse for wave C black. When we see significant movement below this channel, and not just an overshoot, then we may consider that confirmation of a trend change at intermediate and primary degree.
Until we have confirmation of this trend change then we must still consider the alternate wave count below.
At this stage movement to a new low below 1,249.05 would provide some confidence in this wave count.
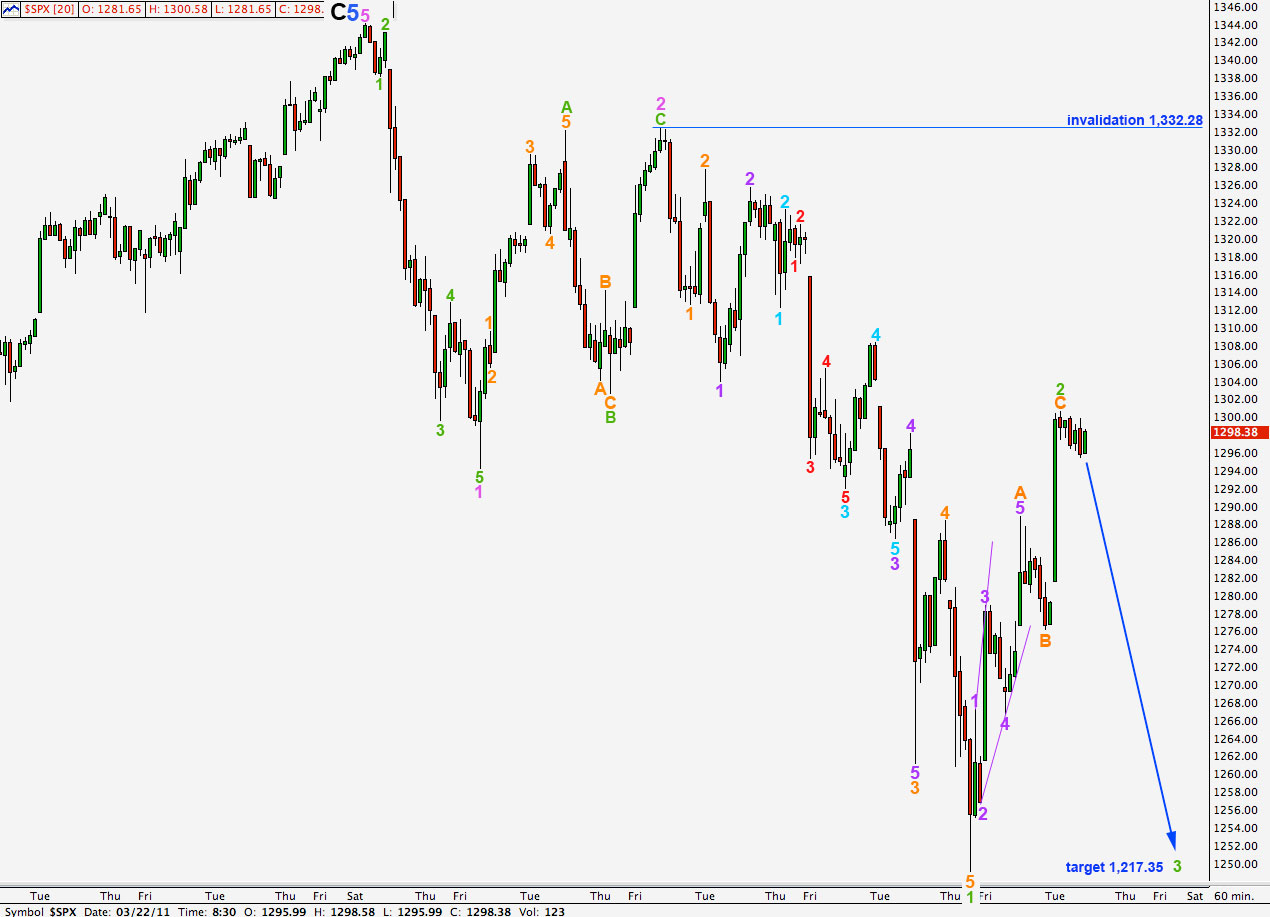
The labeling on this hourly chart is exactly the same as yesterday’s analysis with the exception of the degree of labeling within wave 3 pink downwards.
Movement above the first invalidation point at 1,294.26 invalidated yesterday’s degree of labeling. We have only seen wave 1 green within wave 3 pink.
Ratios within wave 1 green are as stated in yesterday’s analysis.
Within wave 2 green wave A orange is a leading expanding diagonal. Wave C orange is just 0.21 points short of 0.618 the length of wave A orange.
Wave 2 green is a satisfactory zigzag structure and there is a very close fibonacci ratio between waves A and C within it, so it is likely that it was over at 1,300.58.
If this wave count is correct then the most likely next movement should be downwards. At 1,217.35 wave 3 green will reach equality with wave 1 green.
If wave 2 green extends higher as a double combination correction then it may not move beyond the start of wave 1 green. Movement above 1,332.28 would invalidate this wave count. At that stage we should use the alternate wave count below.
Alternate Wave Count.
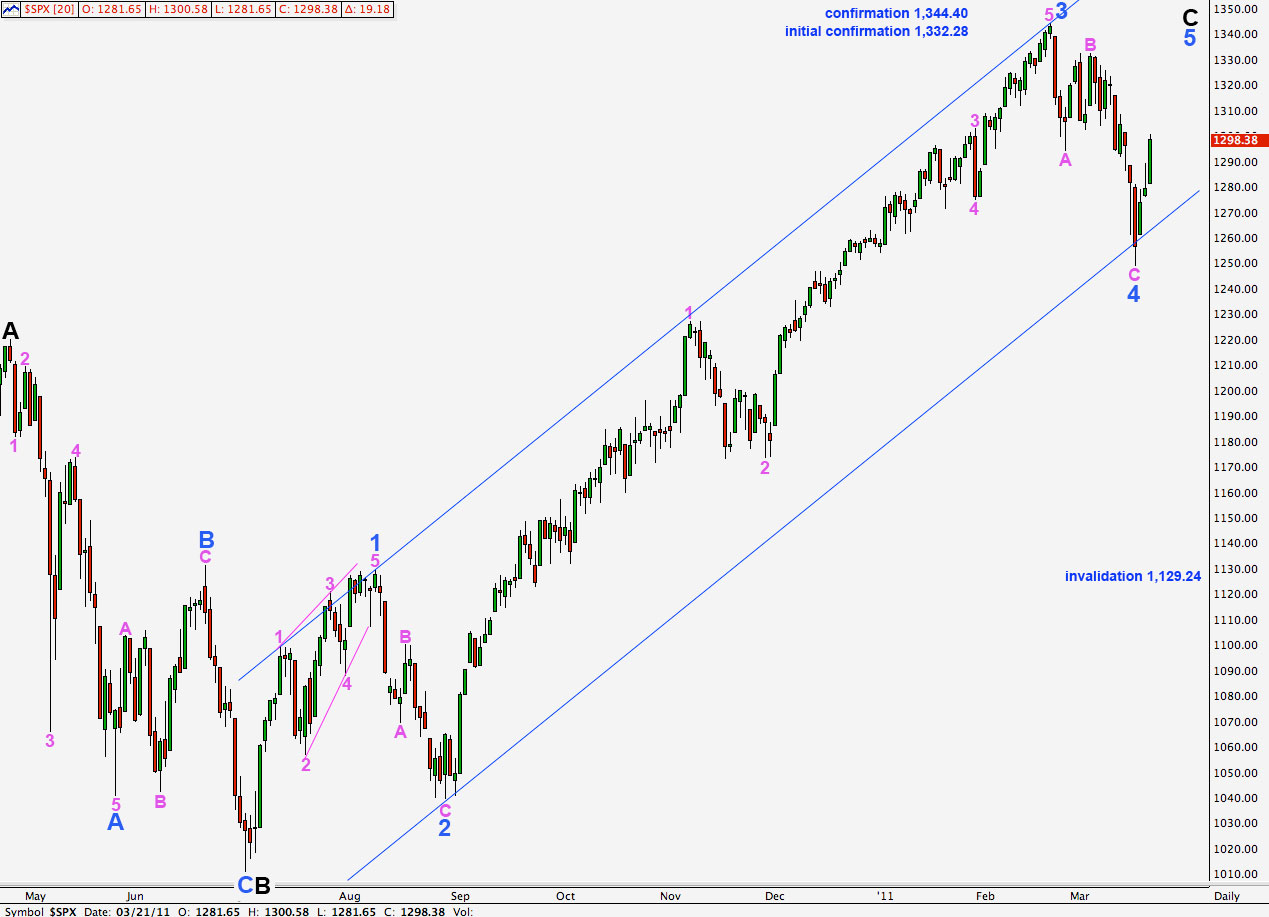
If this wave count is correct then we should see continuing upwards movement for the next few days to weeks, at least.
Movement above 1,332.28 will provide some confidence in this wave count. Movement above 1,344.4 will fully confirm it.
Wave 4 blue may not move into wave 1 blue price territory. Movement below 1,129.24 would completely invalidate this wave count. At that stage downwards movement would have to be primary wave 3 down.
Significant movement below the wide blue parallel channel would make this wave count look extremely unlikely well before 1,129.24 would be breached.
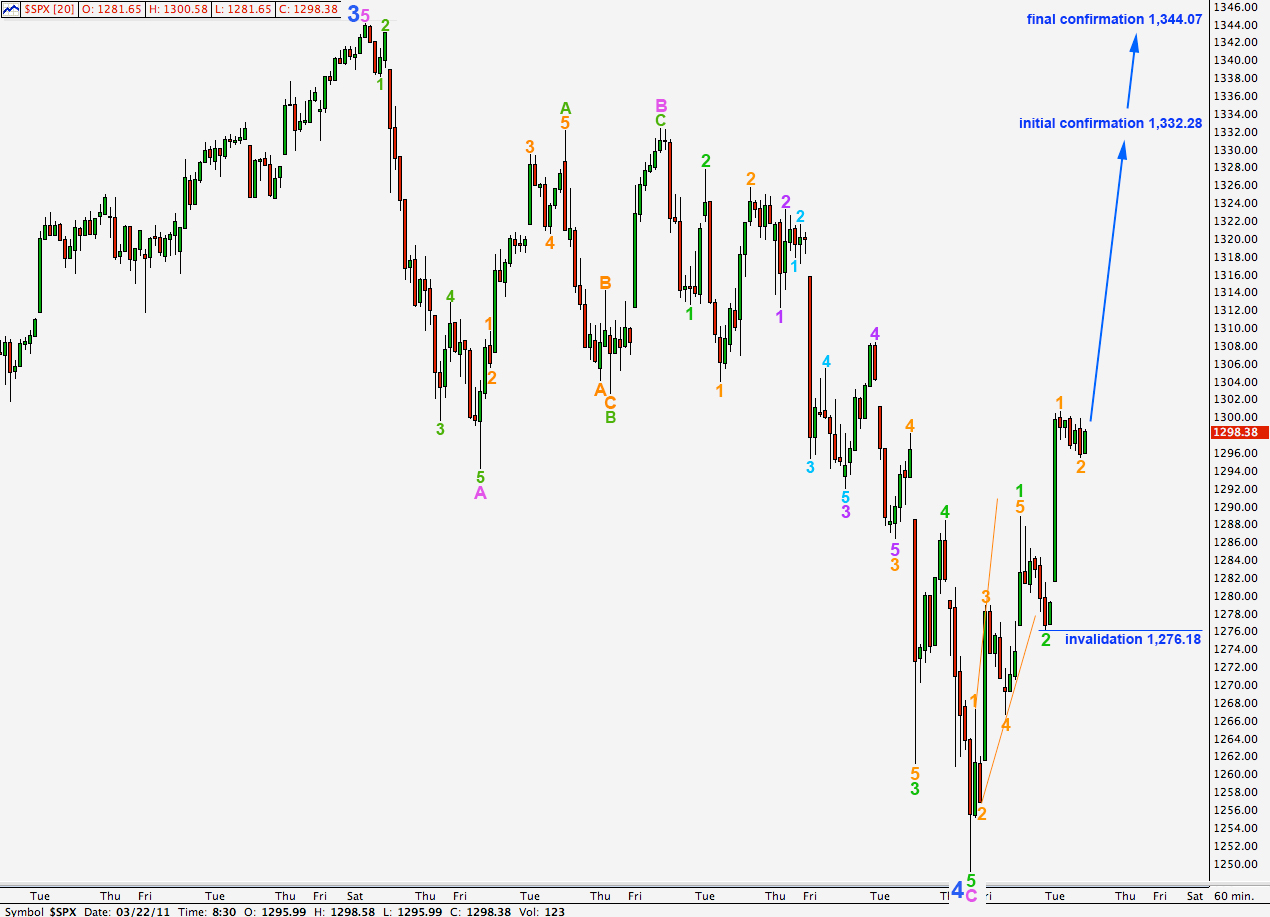
If this wave count is correct then it is highly likely that wave 4 blue is complete. Wave C pink within wave 4 blue zigzag is just 2.64 points longer than 0.618 the length of wave A pink.
The first piece of upwards movement for wave 1 green is a leading expanding diagonal.
Within wave 3 green any further downwards movement of wave 3 orange may not move beyond the start of wave 1 orange. This wave count is invalidated by movement below 1,276.18.
Further movement below 1,249.05 to a new low would invalidate this wave count. At that stage it would look extremely unlikely.