
Elliott Wave chart analysis for the SPX500 for 17th March, 2011. Please click on the charts below to enlarge.
The S&P has behaved as expected for Thursday’s session, moving slowly higher for a fourth wave correction.
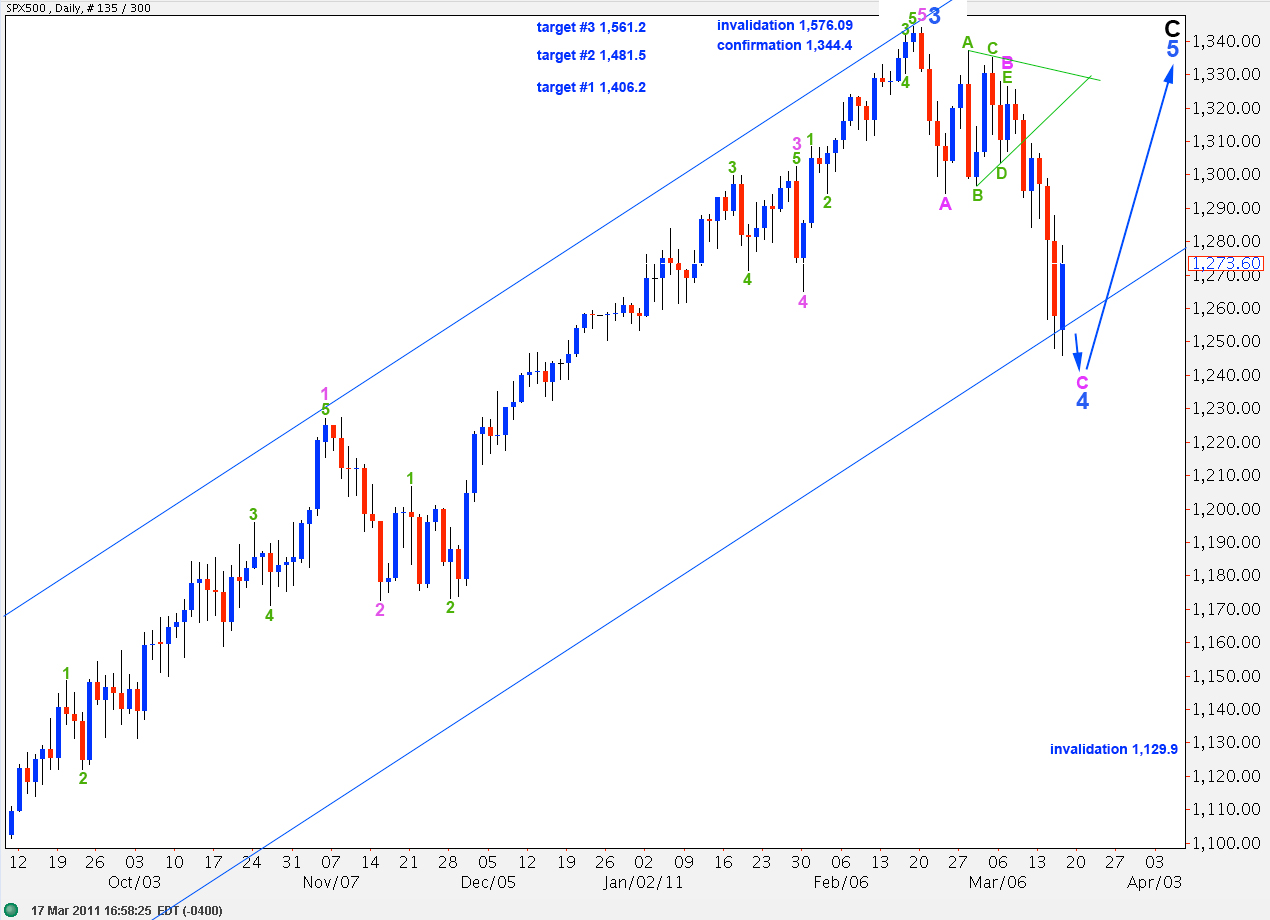
If this wave count is correct then this correction is very close to finishing. The next movement should be downwards for a final fifth wave to end wave C impulse and wave 4 blue zigzag.
I have redrawn the triangle trendlines to extend them further and I have taken more care in drawing them today. They will cross over in one or two more days time, which may coincide with the Dow also being due for a trend change at that time.
We are seeing a nice overshoot of the wide blue parallel channel for wave 4 blue. If this wave count is correct then it is likely that the fifth wave upwards to come should overshoot the channel on the opposite side.
Wave 4 blue may not move into wave 1 blue price territory. This wave count is invalidated with movement below 1,129.9.
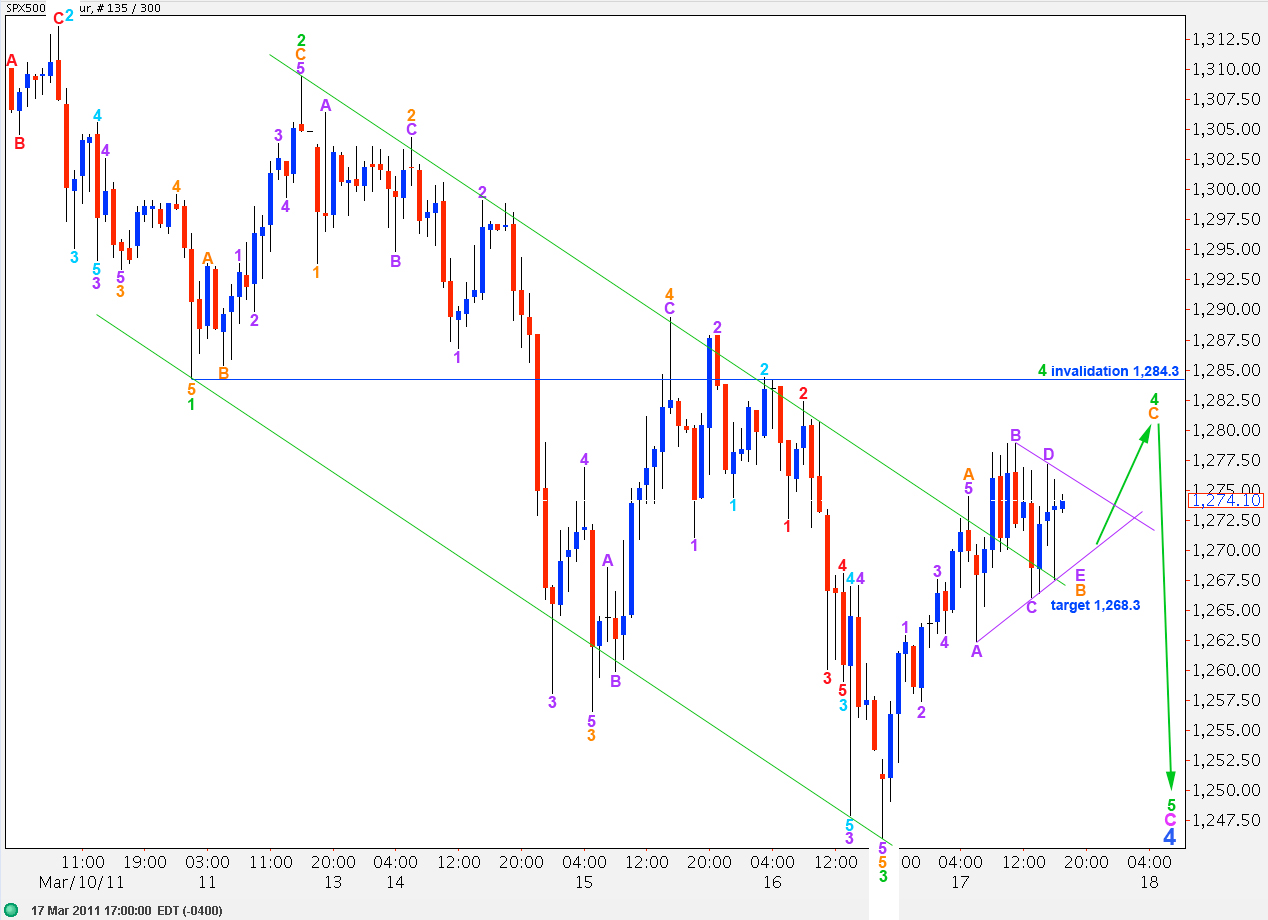
We were expecting wave 3 green to end a little lower. This was not the case and wave 4 green upwards is unfolding.
Wave 3 green is 4.7 points short of 1.618 the length of wave 1 green.
Wave B orange within wave 4 green looks like it may be unfolding as a small triangle. If this triangle structure remains valid and we see a satisfactory completion of five subwaves within it (checking this on a 15 minute chart) then we may expect that there is a high probability of price shooting out strongly upwards for a short thrust when the triangle is over.
This would end wave 4 green zigzag.
Wave 4 green has overshot the trend channel drawn about wave C pink downwards. This may indicate an overshoot on the opposite side of the trend channel to come for wave 5 green.
When we have a known end to wave 4 green we should expect wave 5 green to come will be most likely 42.1 points in length to reach equality with wave 1 green.
Alternate Wave Count.
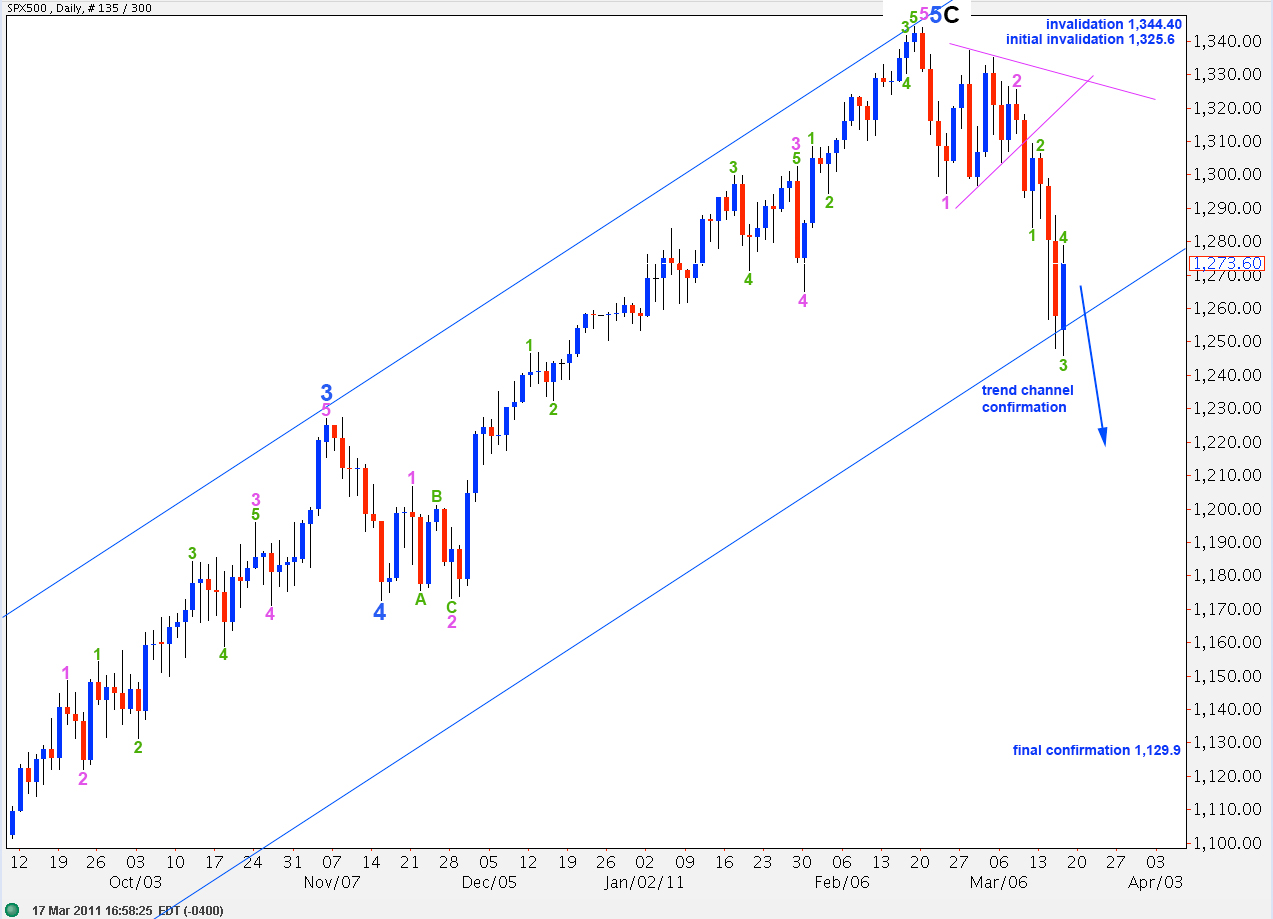
This wave count sees primary wave 2 zigzag as over and primary wave 3 underway.
At this stage this is the best fit for a bearish wave count that I can see. It has a very low probability simply because of the rarity of a triangle for a second wave.
Movement above 1,325.6, the end of the triangle, would put serious doubt on this wave count. Any second wave correction within wave 3 pink may not move beyond its start.