
Elliott Wave chart analysis for the SPX500 for 15th March, 2011. Please click on the charts below to enlarge.
Downwards movement below 1,286.8 invalidated the main wave count and confirmed the alternate on the hourly chart. At that stage we expected wave C pink to move lower.
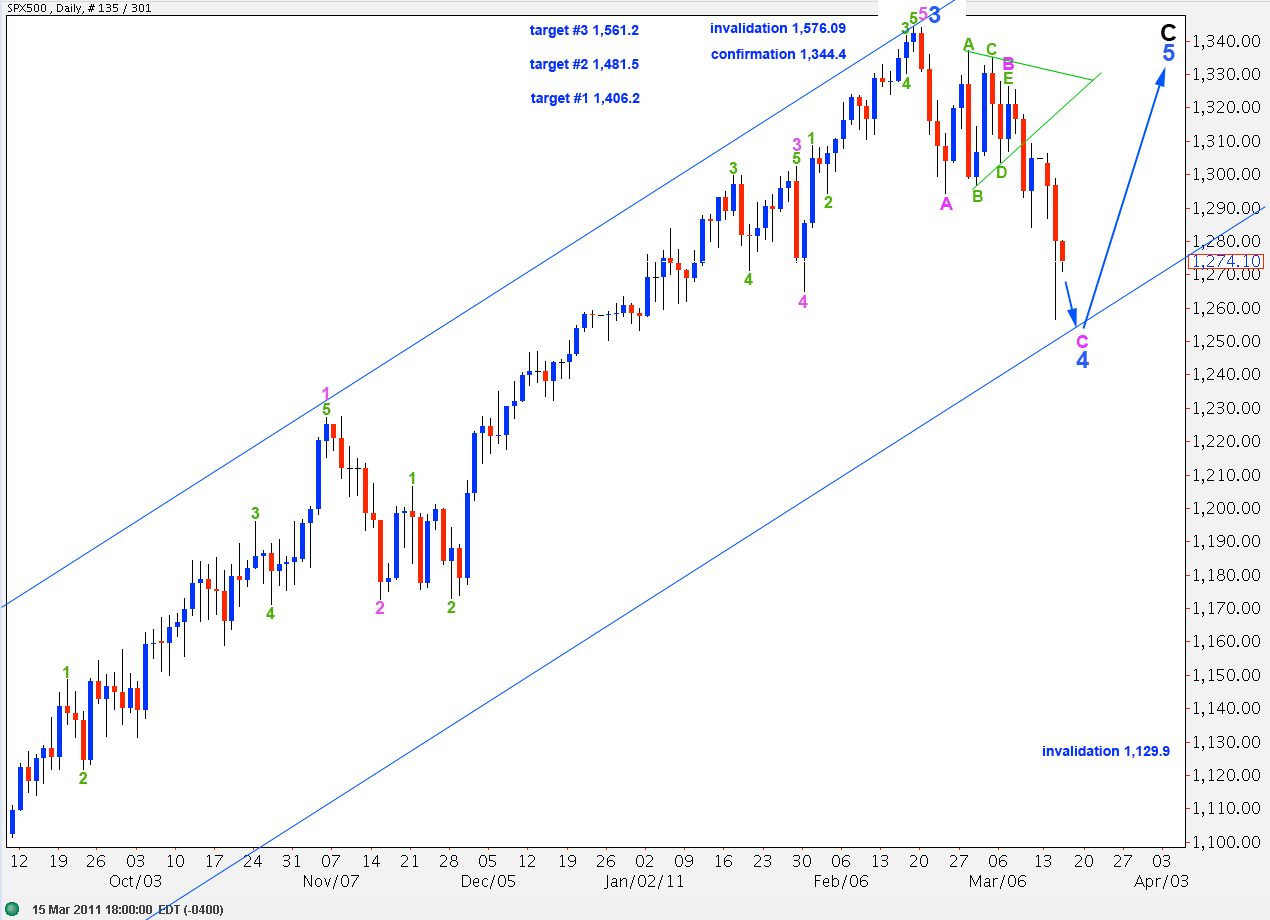
At this stage wave C pink is not a complete impulsive structure. We should see further downwards movement before this is over.
At 1,245.5 wave C pink will reach 1.618 the length of wave A pink. This is our target for wave 4 blue to end.
Wave 4 blue may not move into wave 1 blue price territory. This wave count is invalidated with movement below 1,129.9.
Wave C black to end primary wave 2 zigzag may not move beyond the start of primary wave 1. This wave count is invalidated with movement above 1,576.09.
When we see significant movement below this wide blue parallel trend channel then we may have indication that we have seen a trend change and primary wave 3 would be underway. We may be confident that primary wave 3 is underway when we see movement below 1,129.9. At that stage we should expect the S&P to make new lows below 666.8.
** I have looked at alternate bearish wave counts. The only possibility where subdivisions fit is pink 1-2-3 where our main wave count sees pink A-B-C. This is problematic in that it sees a triangle as the sole corrective structure for a second wave which is extremely unusual. Therefore, this wave count has a very low probability.
Another alternate possibility I have considered is that we may have a second wave over as a zigzag A-B-C where these green labels are for the triangle on the chart above. That possibility has a big problem in the subdivision of wave B within the zigzag. When viewed on an hourly chart this downwards wave looks very much like a five wave impulse, and we should not be trying to fit a wave count which sees that as a B wave.
At this stage I do not have a decent looking bearish alternate which sees primary wave 3 down as underway. I will keep looking and will publish one if I see it. **
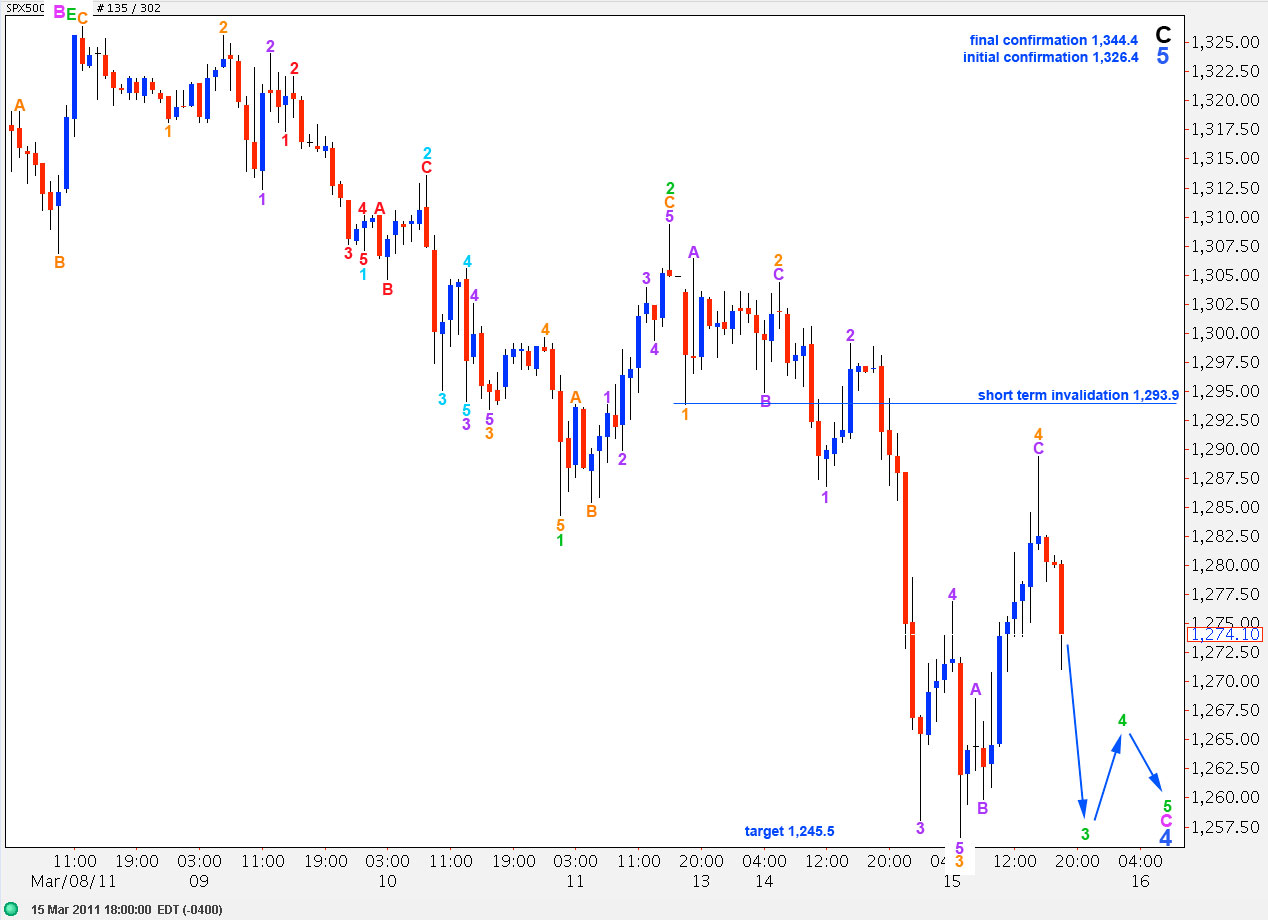
At this stage wave C pink requires further downwards movement to complete a satisfactory impulsive structure. Wave C pink must be unfolding as an impulse because the first wave within it subdivides into an impulse. The only other possibility for a C wave is an ending diagonal which requires all subwaves to subdivide into zigzags.
In the short term we should not expect any further extension of wave 4 orange to move into wave 1 orange price territory above 1,293.9.
Ratios within wave 3 orange of wave 3 green are: there is no adequate fibonacci ratio between wave 3 purple and wave 1 purple and wave 5 purple is 2.7 points longer than equality with wave 1 purple.
When wave 5 orange downwards ends wave 3 green then we should expect another upwards fourth wave correction. At that stage we may move the invalidation point down to the end of wave 1 green at 1,284.3.
When we have an end to waves 3 and 4 green I can calculate a more accurate target for wave 4 blue to end.