Elliott Wave chart analysis for the SPX500 for 9th March, 2011. Please click on the charts below to enlarge.
The S&P has continued to move sideways within a narrowing range. All wave counts presented yesterday remain valid. Again, some are now looking even more likely than others but the situation still remains unclear. What is clear is that it is closer to an end and we shall have clarification as soon as within another 2 days.
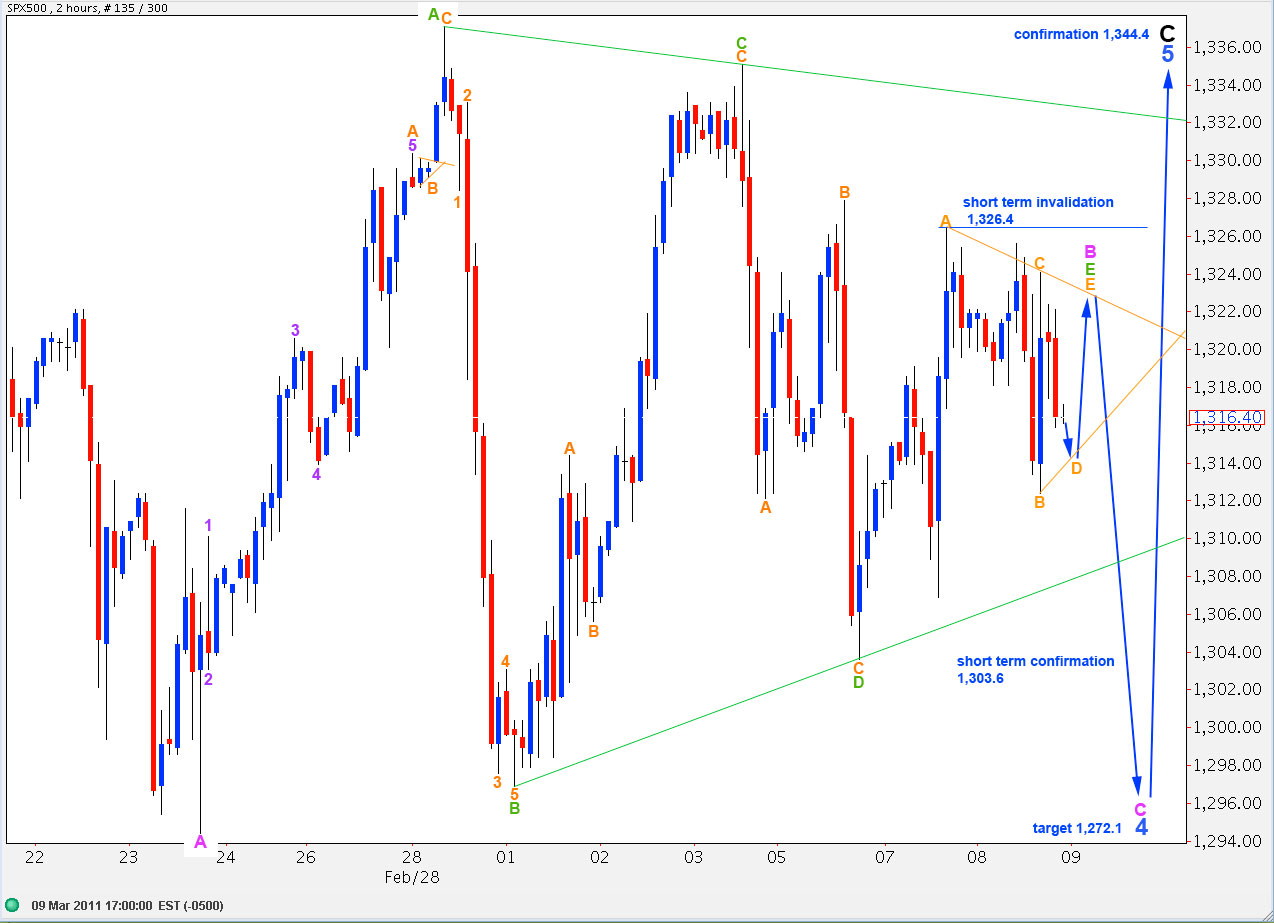
Bearish Wave Count #1
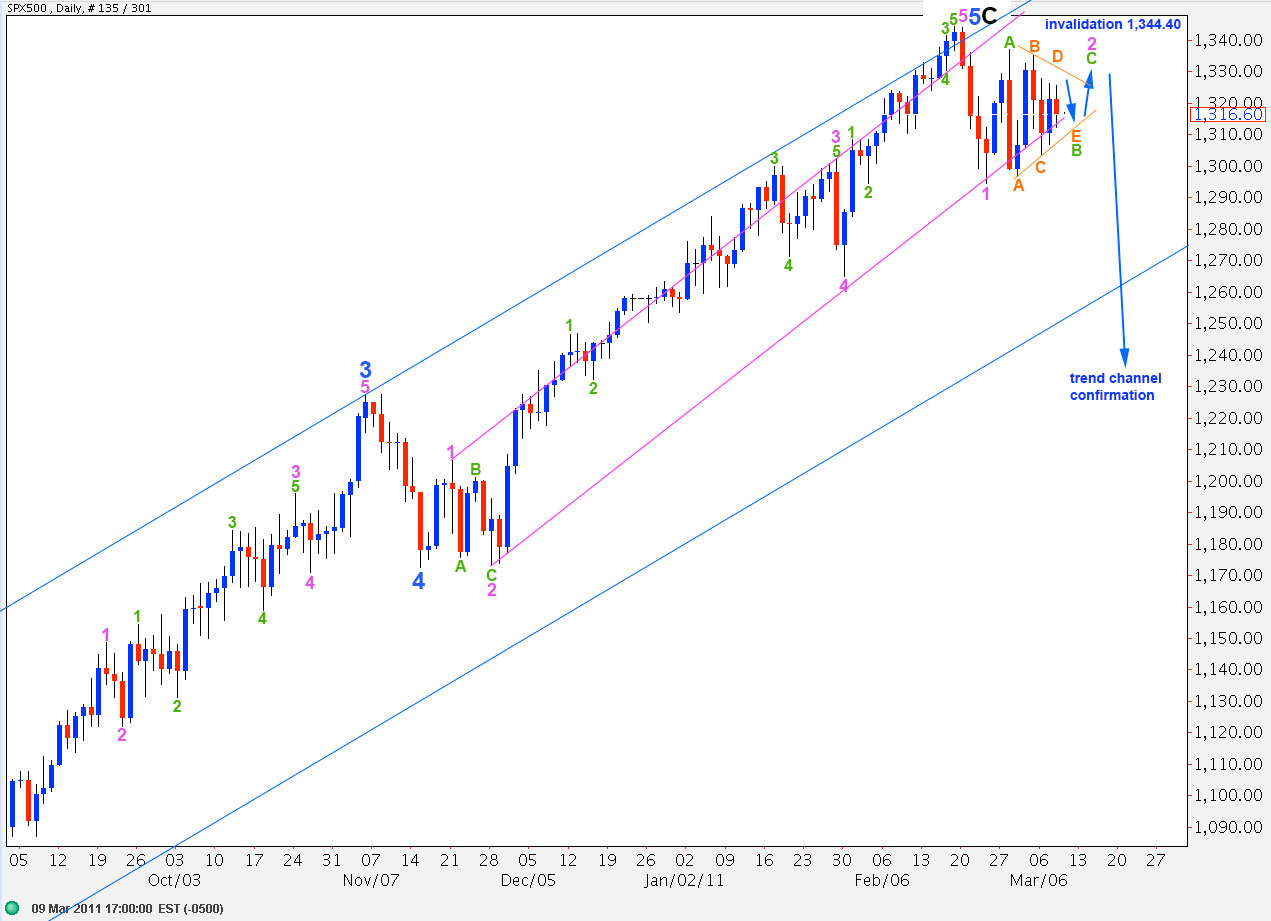
Of our two bearish wave counts this one is now looking much more likely than the other. The triangle structure is much to obvious to try and ignore.
Wave 2 pink is here unfolding as a zigzag. Wave 2 may not move beyond the start of wave 1 pink. This wave count is invalidated with movement above 1,344.4.
Within wave 2 pink wave B green is unfolding as a triangle. This triangle may have just ended.
We will know that the triangle is over when price moves above 1,326.4, the end of wave D orange.
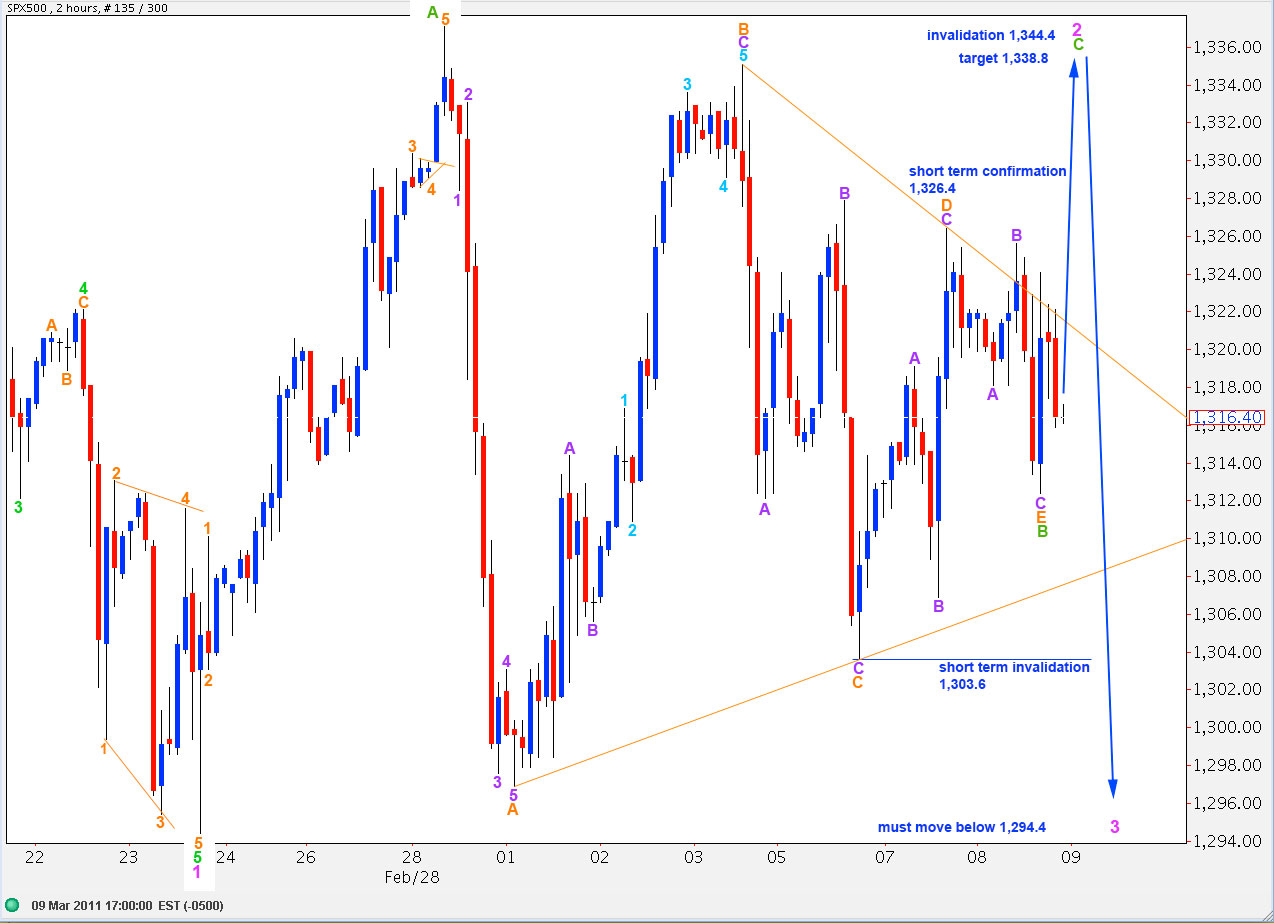
This 2 hourly chart shows almost all of wave 2 pink so far.
Within wave B green triangle wave E orange is just 0.1 points longer than 0.618 the length of wave D orange. Wave E orange has fallen short of the A-C trend line.
This triangle structure as labeled here is almost perfect.
Movement above 1,326.4 would provide some indication that this wave count is valid. However, it would not be the only valid wave count at that point.
At 1,338.8 wave C green would reach 0.618 the length of wave A green and wave 2 pink would be a complete zigzag structure.
The next move would be then a strong third wave down to new lows.
Yesterday’s Bearish Wave Count #2 is now looking so unlikely as to be all but eliminated. Because it ignores the obvious triangle structure which has unfolded I will not present it again.
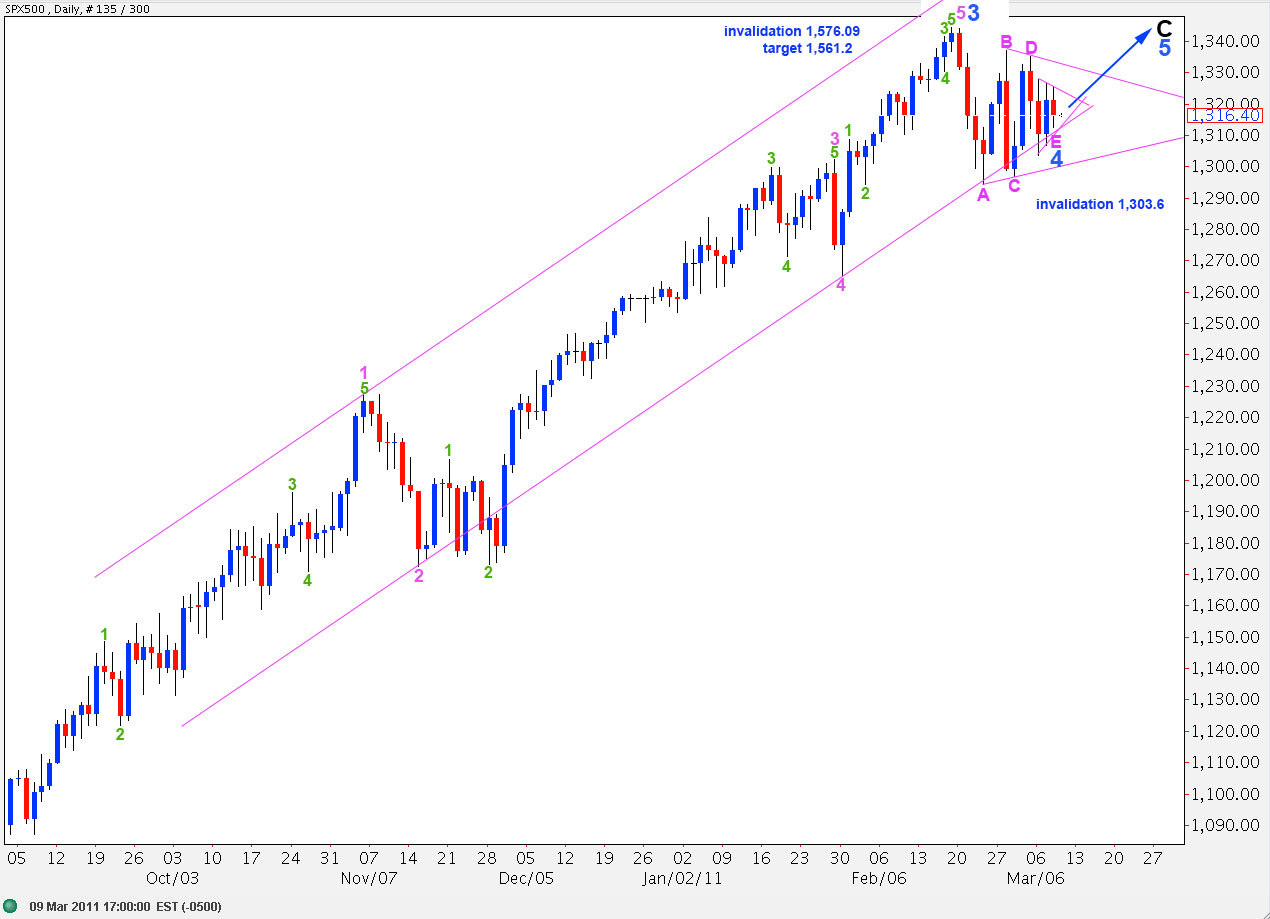
Bullish Wave Count #1
This wave count and the second bullish wave count are the most likely of these three at this stage. I will chart this one on the 2 hourly as the next is essentially the same as the bearish wave count in its subdivisions.
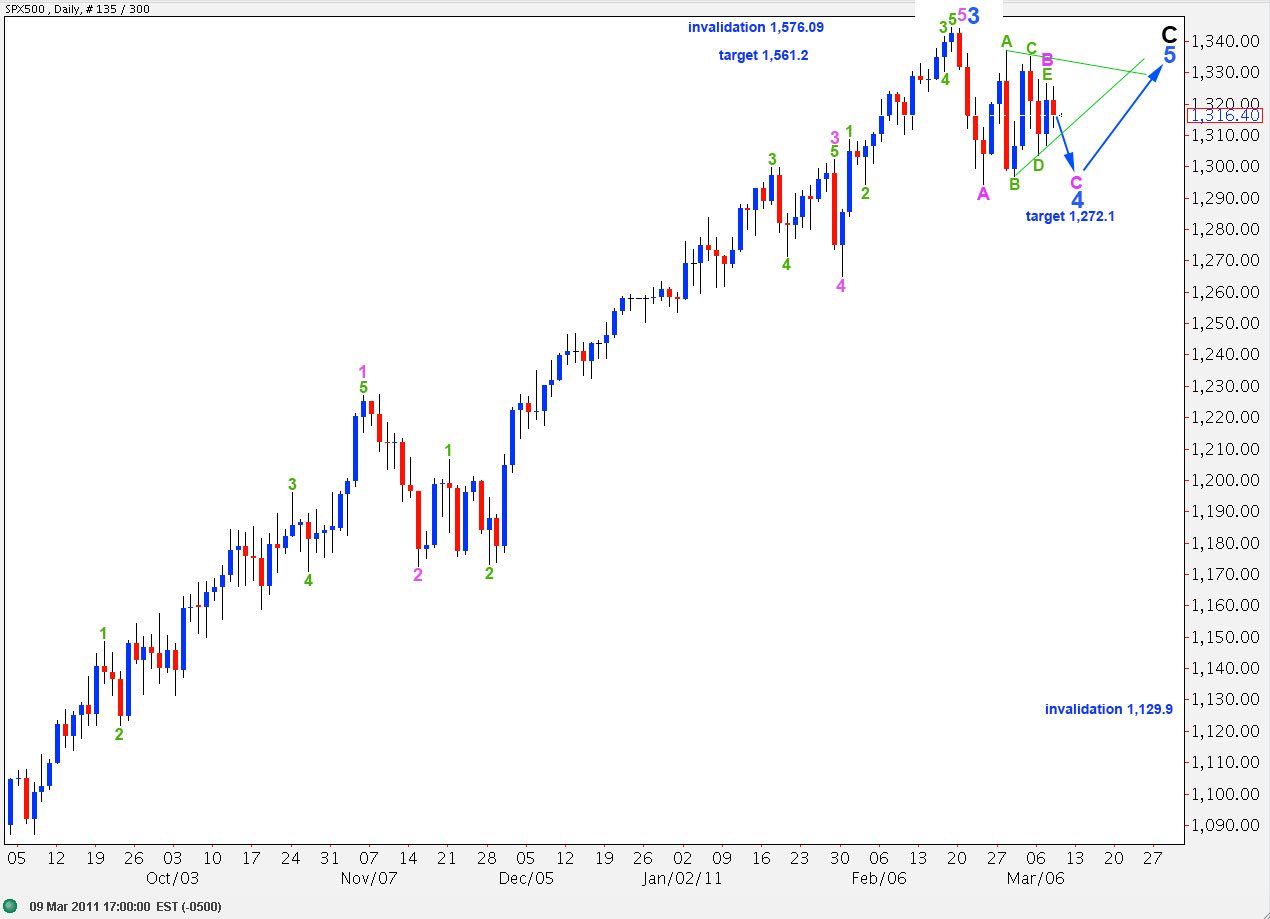
This wave count sees wave 4 blue as a zigzag and the triangle is a B wave within it.
Wave B pink is either over or very nearly so. At 1,272.1 wave C pink will reach equality with wave A pink to end this fourth wave correction.
Thereafter, wave 5 blue will take the S&P to new highs.
Wave 4 blue may not move into wave 1 blue price territory. This wave count is invalidated with movement below 1,129.9.
On the 2 hourly chart we can see that wave B pink may be almost over. In the short term any movement above 1,326.4 would invalidate this wave count wave C orange may not end beyond the end of wave A orange.
If the triangle ends and price moves out of it downward then our first indication that this wave count is correct would be movement below 1,303.6. However, it would not be the only wave count which would be correct at that stage so movement below this point is not a long term bullish confirmation.
None of the subwaves of this triangle are 0.618 the length of its predecessor. We do see that relationship in the next bullish wave count though.
This labeling sees wave E green completing as a triangle within the triangle. It requires only one final very small upward zigzag to end it.
Bullish Wave Count #2
This alternate bullish wave count sees the triangle as all but over. Wave E pink within the triangle is most likely itself a triangle.
None of the subwaves of this triangle is close to 0.618 the length of its predecessor.
The triangle for wave E pink is likely to have just ended.
If price moves sharply upward above 1,326.4 then this wave count will remain valid. If upward movement continues through 1,344.4 then this wave count will be the only correct wave count. At that stage we should expect a continuation of long slow upward movement toward the target 1,576.09 where wave C black will reach equality with wave A black.
In the short term movement below 1,303.6 would invalidate this wave count.
Bullish Wave Count #3
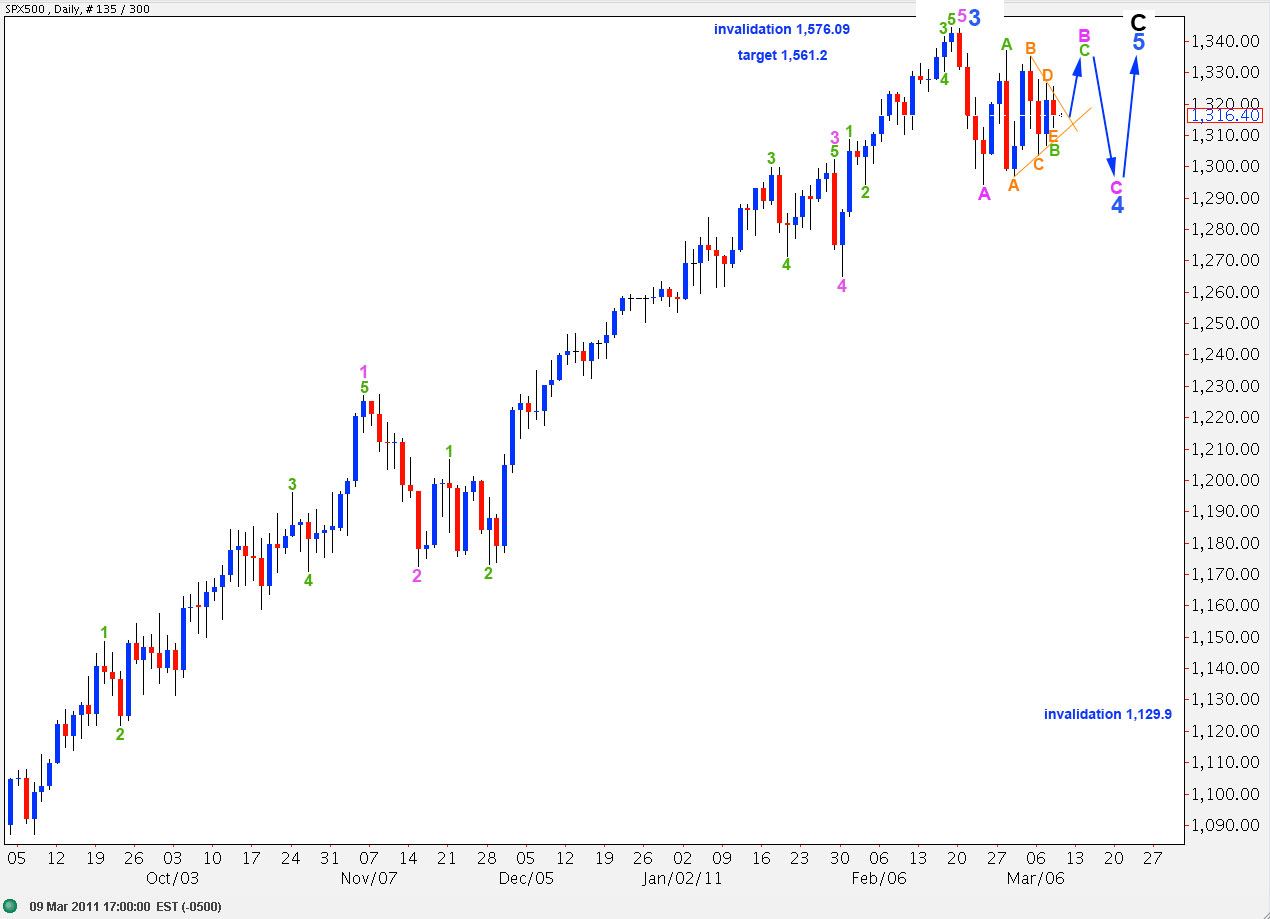
The subdivisions of this last bullish wave count are the same as for the first, bearish, wave count.
In the short term movement below 1,303.6 would invalidate this wave count. Movement above 1,326.4 would confirm it.
A-B-C and 1-2-3 look and behave essentially the same. In this case the downward wave which would be either C or 3 may provide us some clues as to which of these scenarios is most likely. Wave behaviour may be stronger for a third wave than a C wave.
To the downside this wave count is only invalidated with movement below 1,129.9.
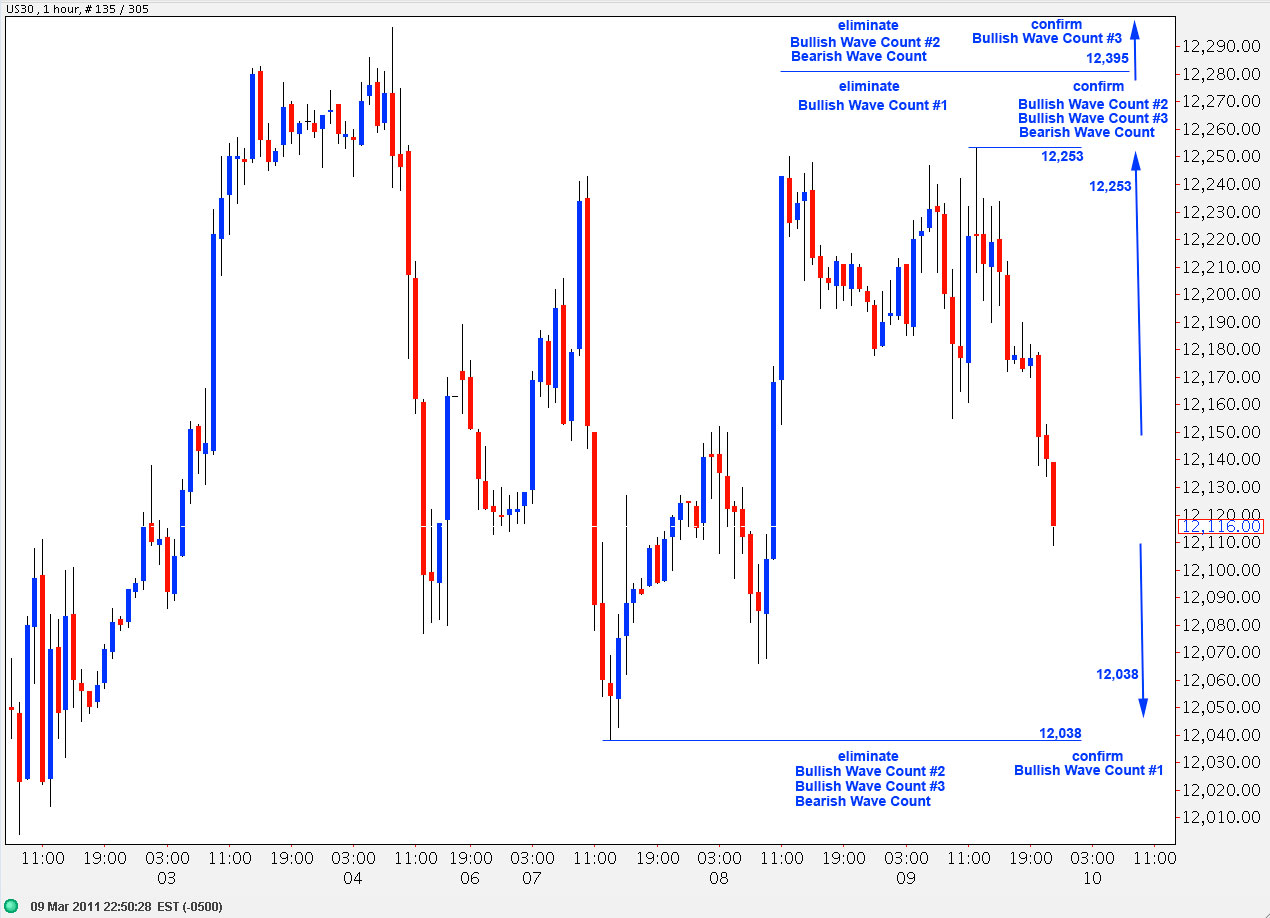
Because this situation is so unclear I have prepared a guide on an hourly chart for you today. This triangle will end very soon. When price breaks out of a zone between 1,326.4 and 1,303.6 the direction in which it breaks out will eliminate some wave counts and confirm others. This guide tells you which ones.