
Elliott Wave chart analysis for the SPX500 for 8th March, 2011. Please click on the charts below to enlarge.
The S&P has moved sideways for Tuesday’s session and all wave counts presented yesterday remain valid. Some are now looking more likely.
At the risk of losing clarity I will publish all possibilities that I can see today. I will group these wave counts as either bullish or bearish and number them within each group presented in order of probability. Another couple of days price movement should eliminate some possibilities as invalidation points are passed.
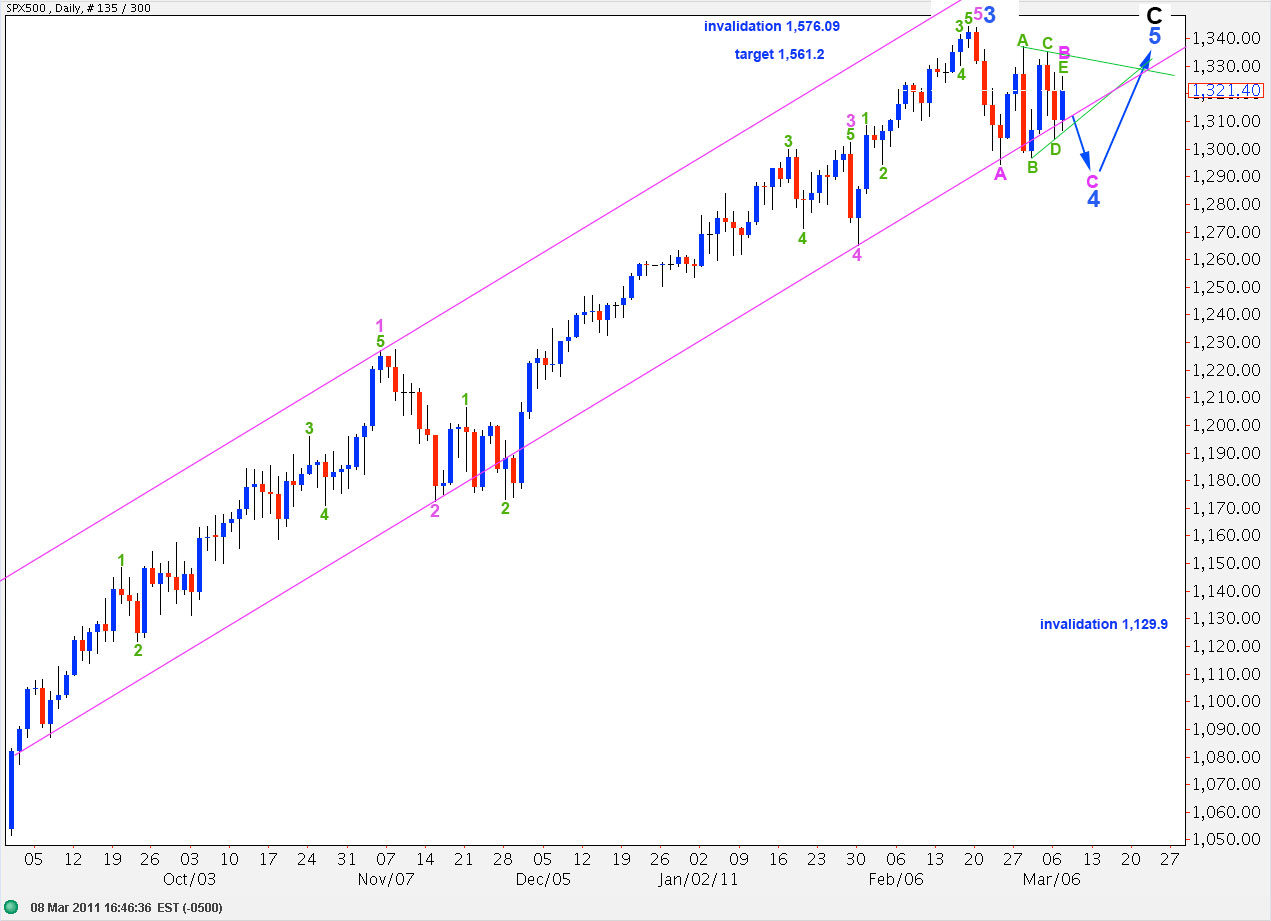
Bearish Wave Count #1.
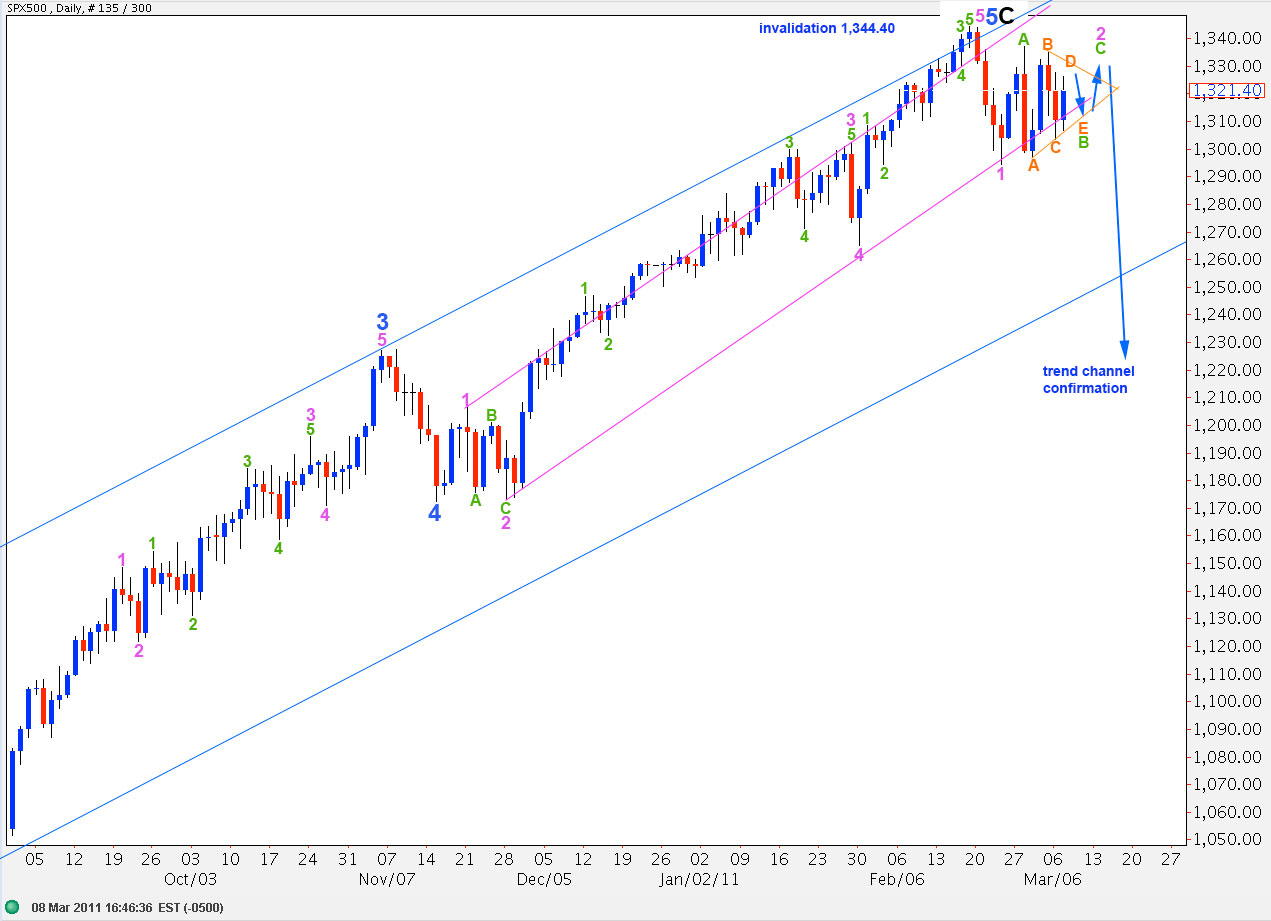
This wave count was presented as an alternate yesterday. It is looking more likely with continued sideways movement looking very much like a triangle now.
This wave count sees wave 2 pink as a zigzag, with wave B green within it a triangle.
When the triangle is completed an upward five wave structure for C green would end pink wave 2. Wave 2 pink may not move beyond the start of wave 1 pink. Therefore, this wave count is invalidated with movement above 1,344.4.
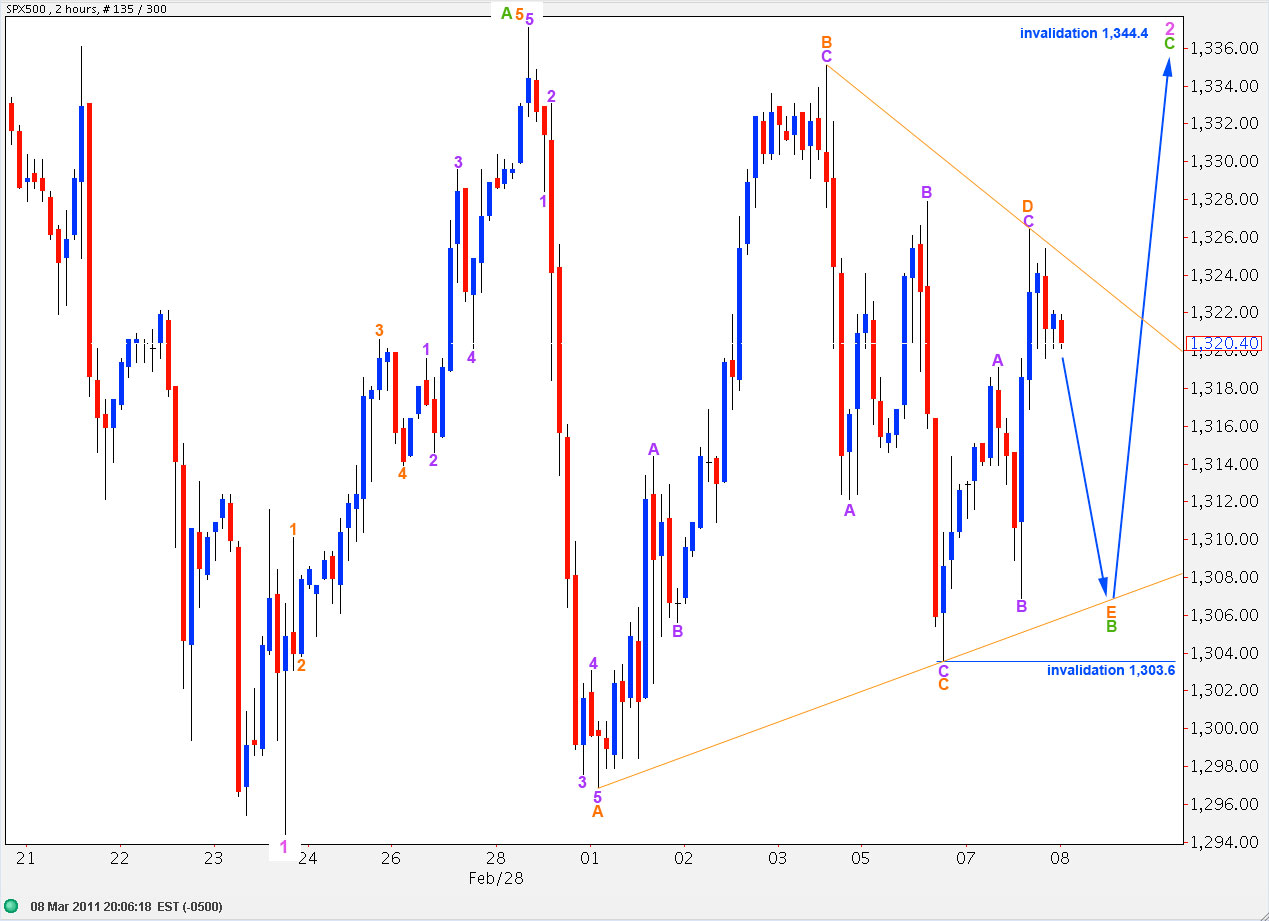
The 2 hourly chart shows all of wave 2 pink so far. The only small problem I have with this wave count is that it is required to see the upward wave labeled here A green as a five wave structure. It is possible, but I think it is a little easier seen as a three. It is ambiguous.
This wave count only requires a small E wave downward to complete the triangle. Following that wave C green upward is required to end wave 2 pink correction.
At this stage (before the end of wave 2 pink) movement below 1,303.6 would invalidate this wave count.
Bearish Wave Count #2.
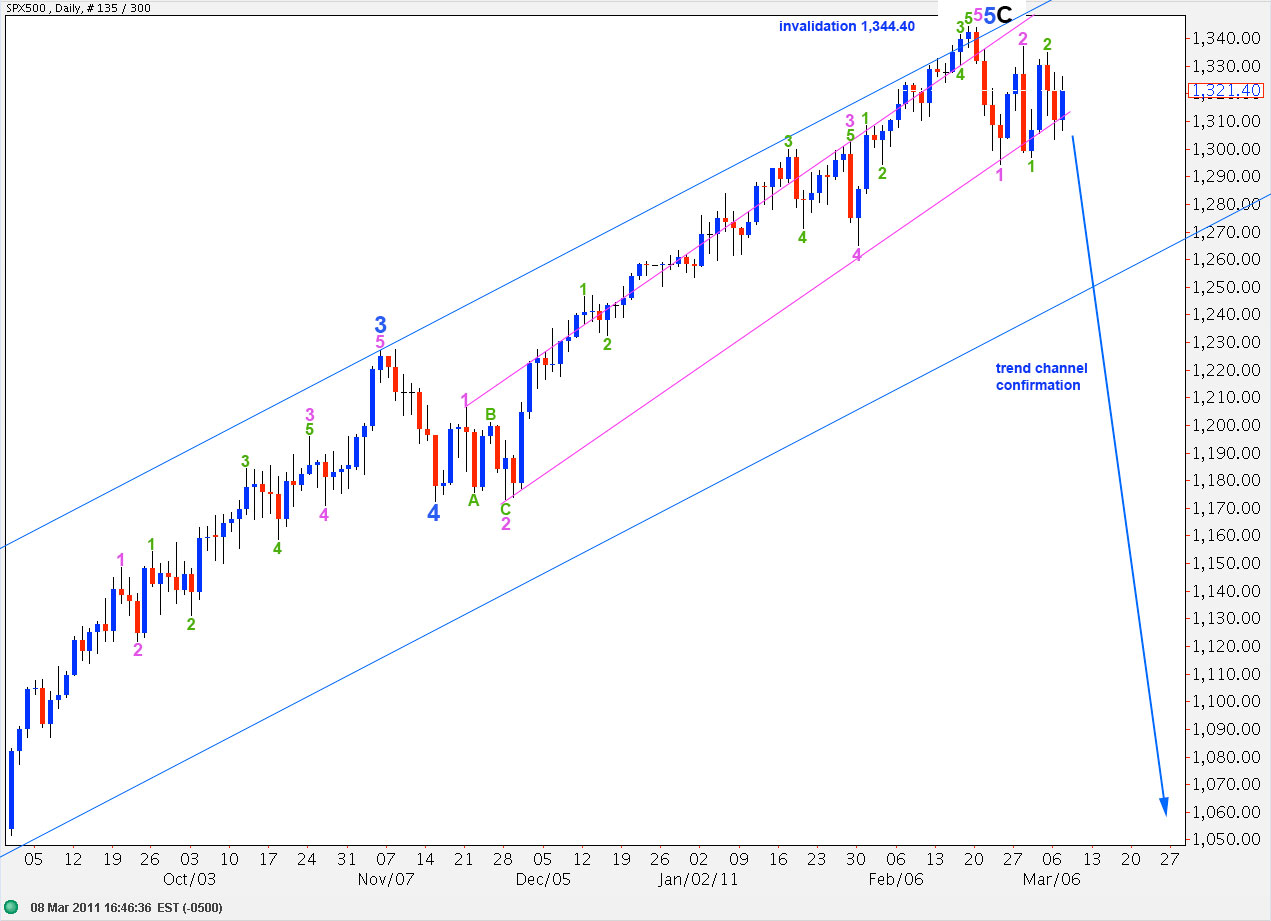
This was our main wave count yesterday. Continued sideways overlapping zigzags strongly suggest a triangle. Therefore, this wave count does not have as high a probability as the first bearish wave count.
Wave behaviour is no longer conforming to this wave count. We should be expecting explosive downward movement at this stage.
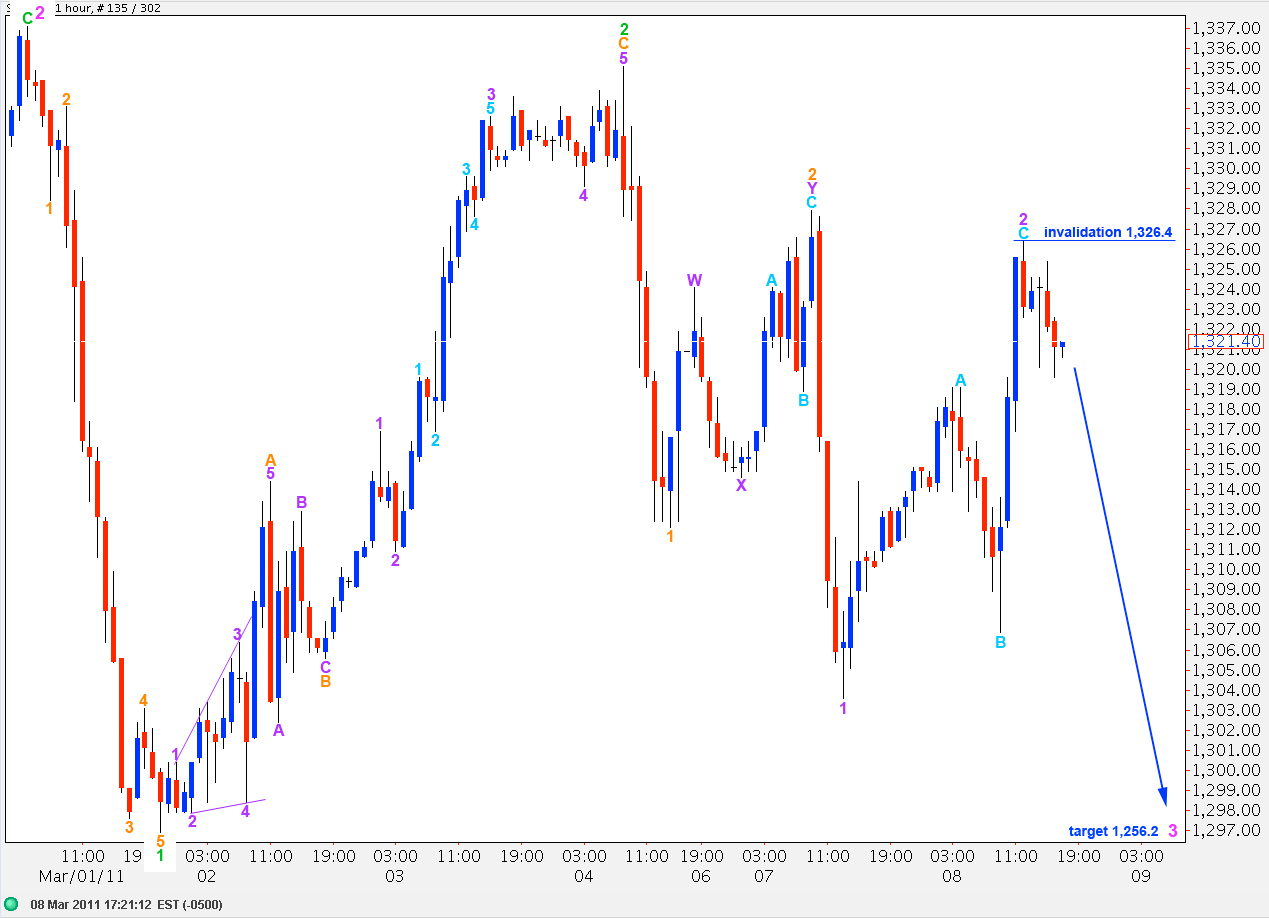
At 1,256.2 wave 3 pink will reach 1.618 the length of wave 1 pink. This is a short term target which should be reached in another couple of days, if this wave count is correct.
At this stage movement above 1,326.4 would be enough to invalidate this wave count.
Bullish Wave Count #1.
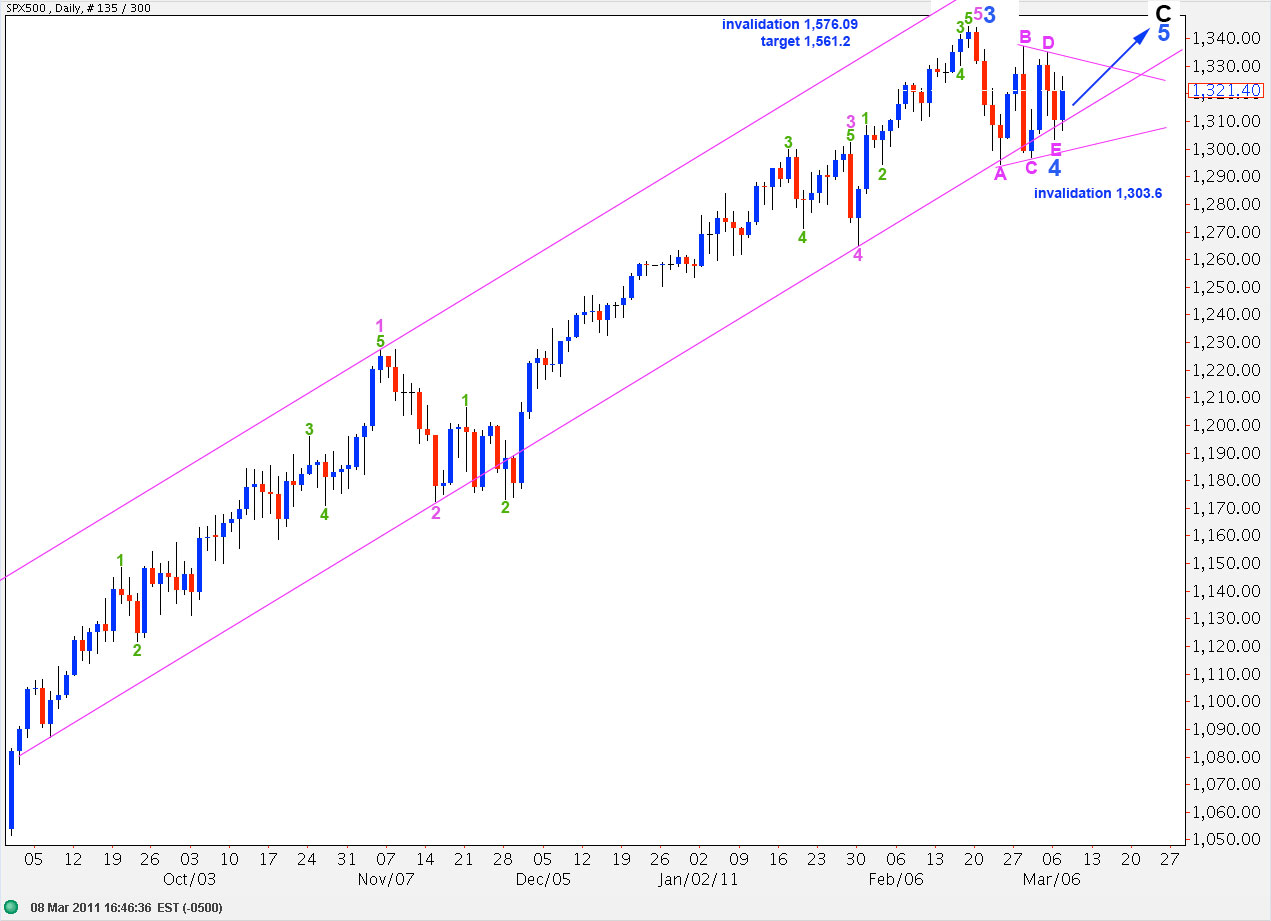
This wave count follows on directly from what was our alternate yesterday.
The triangle could now be complete, unless wave E pink continues as a triangle itself which may last a few more days in duration.
This wave count would be confirmed with movement above 1,344.4. At that stage we should expect a continuation of the long slow steady rise up to the next target at 1,561.2 where wave C black would reach equality with wave A black.
Movement below 1,303.6 would invalidate this wave count.
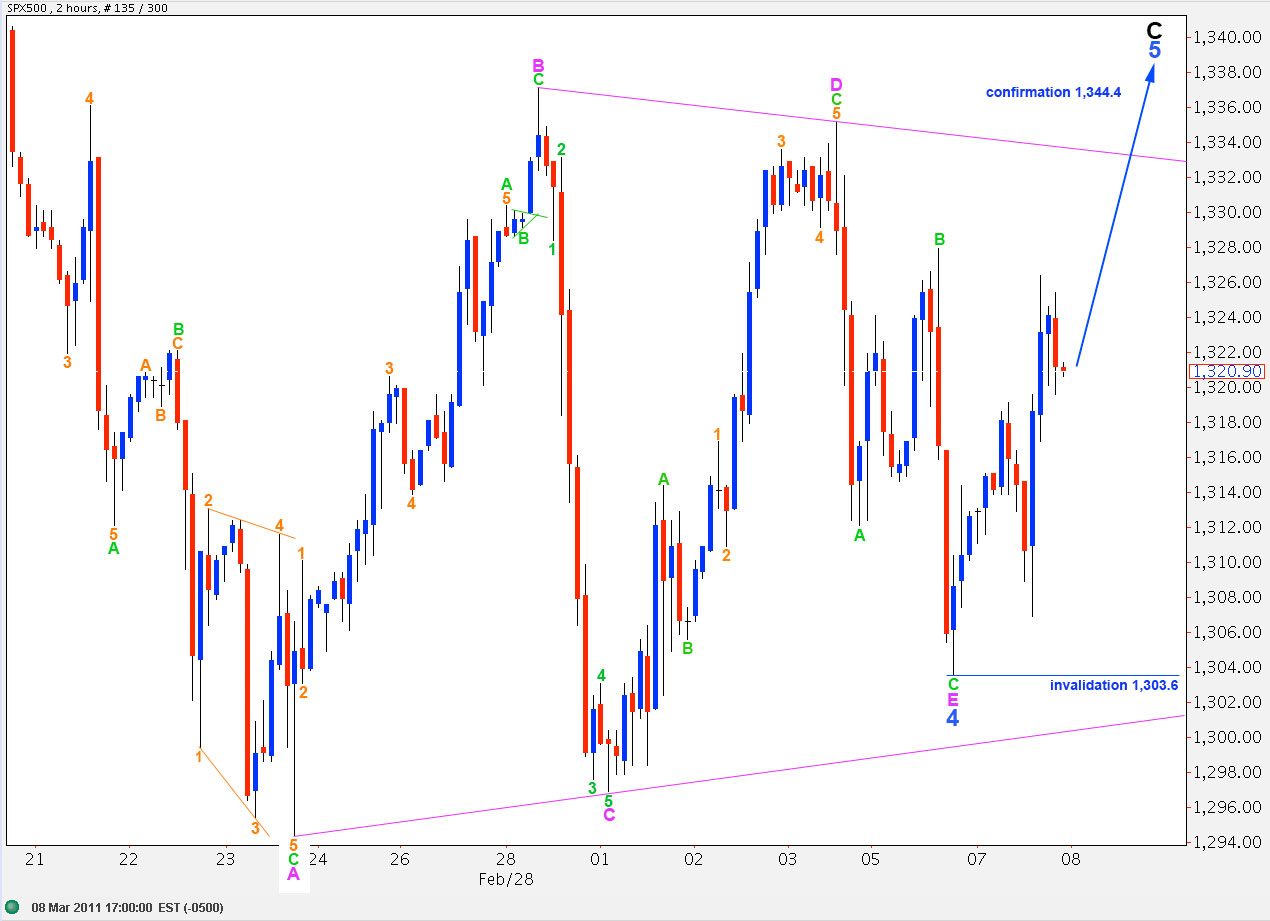
We can see on the 2 hourly chart that the triangle for wave 4 blue may be complete. However, wave E pink may continue sideways below 1,335.1 and above 1,303.6 as a contracting triangle itself, within this contracting triangle.
Movement above 1,335.1 would see the triangle over. At that stage upward movement may be a fifth wave at blue degree which should make new highs.
This wave count is confirmed with movement above 1,344.4.
At this stage this wave count is invalidated with movement below 1,303.6.
Bullish Wave Count #2.
This wave count is essentially the same as the bearish wave count #1, because 1-2-3 and A-B-C look and behave essentially the same.
When the triangle ends if price moves out of it upward then this wave count and the bearish #1 wave count will both remain valid. Only when wave C pink or wave 3 pink downward develops will we have a clue as to which of these two wave counts are correct. The nature and behaviour of that downward wave should provide some information as to which of these wave counts would have a higher probability.
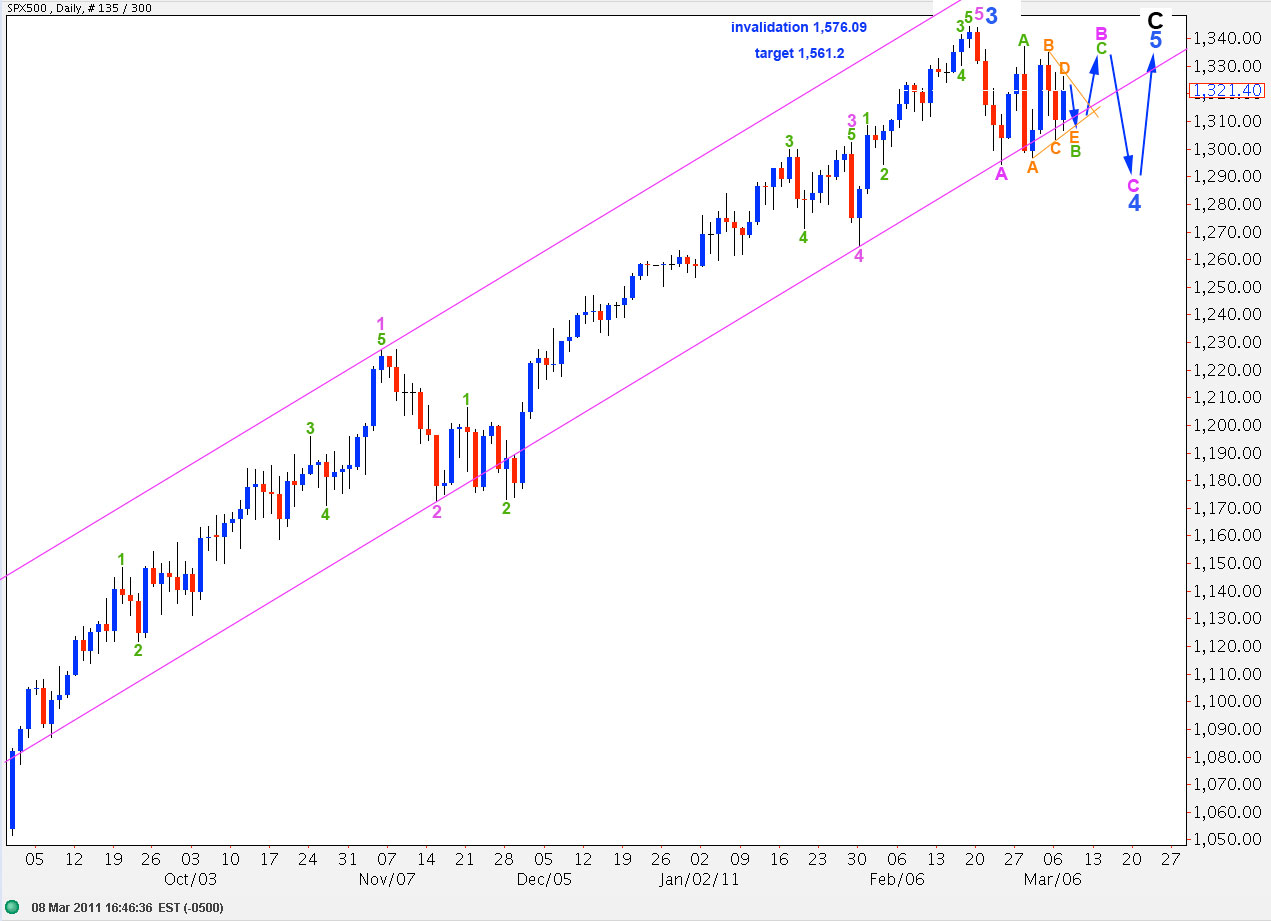
Bullish Wave Count #3.
This wave count sees the triangle as a B wave with price to move upward then it is over. That would be followed by a C wave downward to complete a zigzag for wave 4 blue.
Here the downward wave labeled B green is a clear five wave impulse. The bullish wave count #2 sees that wave as an A wave of a triangle. It is more likely that an A wave of a triangle will be an impulse than a B wave. Therefore, this wave count is less likely than the previous wave count.
This wave count is only invalidated with movement below 1,129.9, the high of wave 1 blue within wave C black. This is because wave 4 blue may not move into wave 1 blue price territory.
However, we should see price movement below the wide blue parallel channel on the daily chart before movement below 1,129.9. So we may have trend change confirmation before this wave count is finally invalidated.
Conclusion.
The situation is particularly unclear at this point in time. Sometimes there are multiple alternate possibilities. We require a few more days to illuminate the situation. We may have clarity as soon as one or two days time, but it could take about a week if the triangle continues with further sideways movement.
When price moves out of the small range it has been trading in we will be able to eliminate these possibilities one by one, until we are left with only one or two.