
Elliott Wave chart analysis for the SPX500 for 4th March, 2011. Please click on the charts below to enlarge.
Recent movement over the last two weeks looks suspiciously like a triangle at this stage. Therefore, I have an alternate wave count for you to end the trading week. We may use confirmation and invalidation points to work with these two wave counts.
Main Wave Count.
It is still likely that we have had a trend change. In order for you to compare fibonacci ratios between the main and alternate wave counts I will detail these for this wave count again below.
At black degree wave C is just 5.5 points short of 0.618 the length of black wave A. As black wave C is 336.4 points long and black A is 553.2 points long, this difference is very small.
At blue degree within black wave C ratios are: wave 3 blue is 8.6 points short of 1.618 the length of wave 1 blue and blue wave 5 is 16.8 points short of equality with wave 3 blue.
Ratios within wave 5 blue are: wave 3 pink is 15 points short of 4.236 the length of pink wave 1 and pink wave 5 is just 0.6 points short of 0.618 the length of pink wave 3.
Ratios within wave 5 pink of wave 5 blue are: wave 3 green is 2.8 points short of 0.618 the length of green wave 1 and green wave 5 is 3.4 points short of 0.618 the length of green wave 3.
Ratios within wave 3 pink of wave 5 blue are: wave 3 green is 6 points short of equality with green wave 1 and green wave 5 is 2.9 points longer than 0.382 the length of green wave 1.
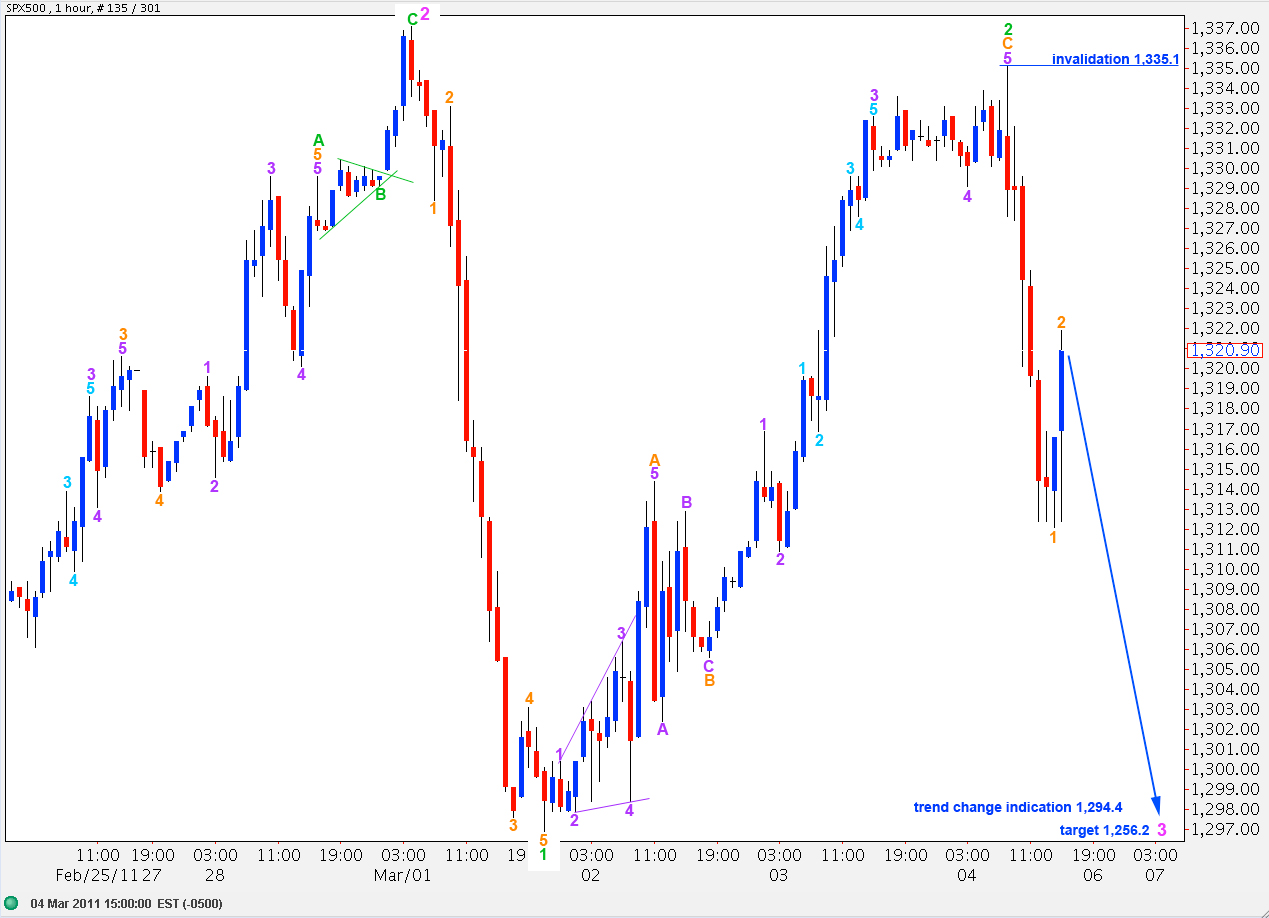
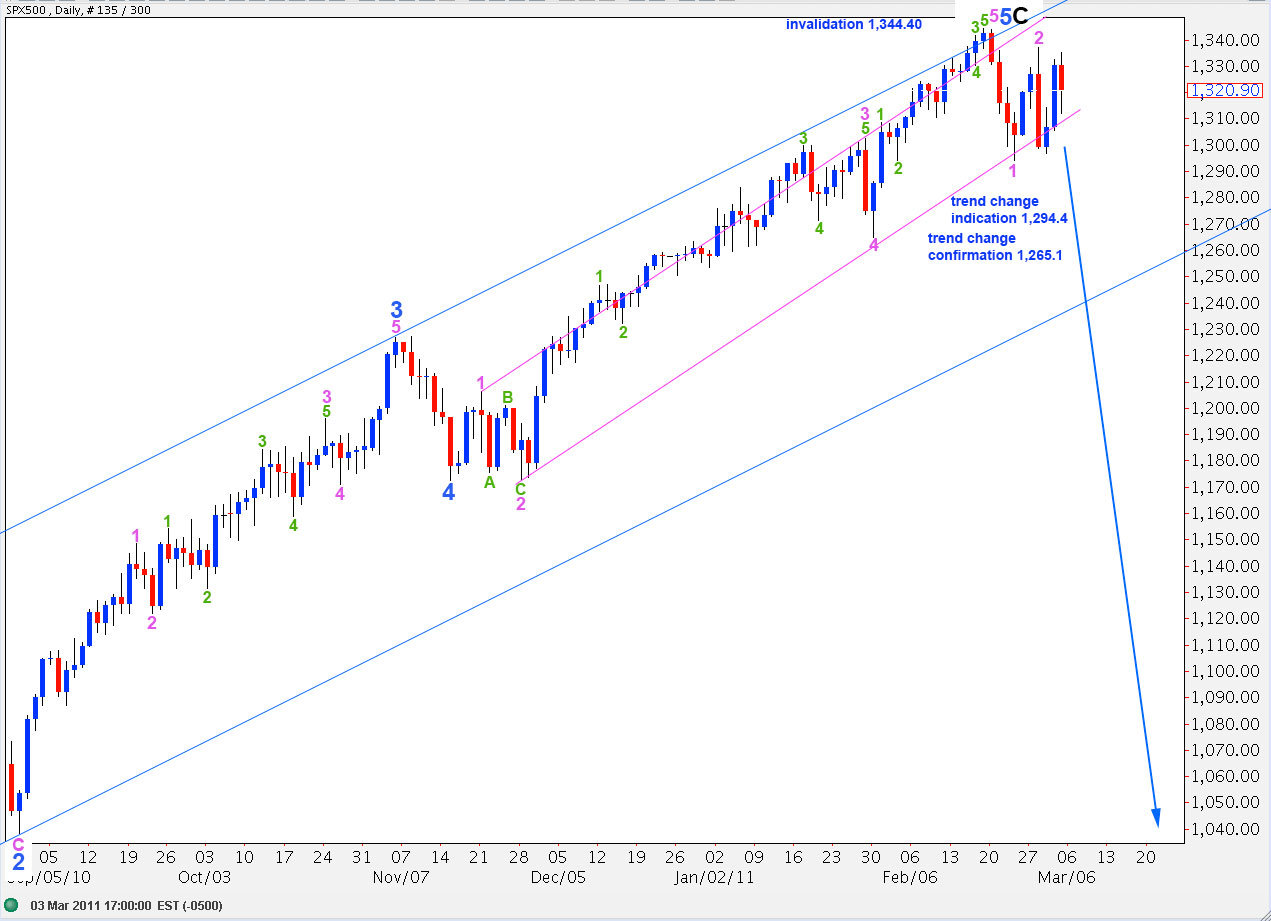
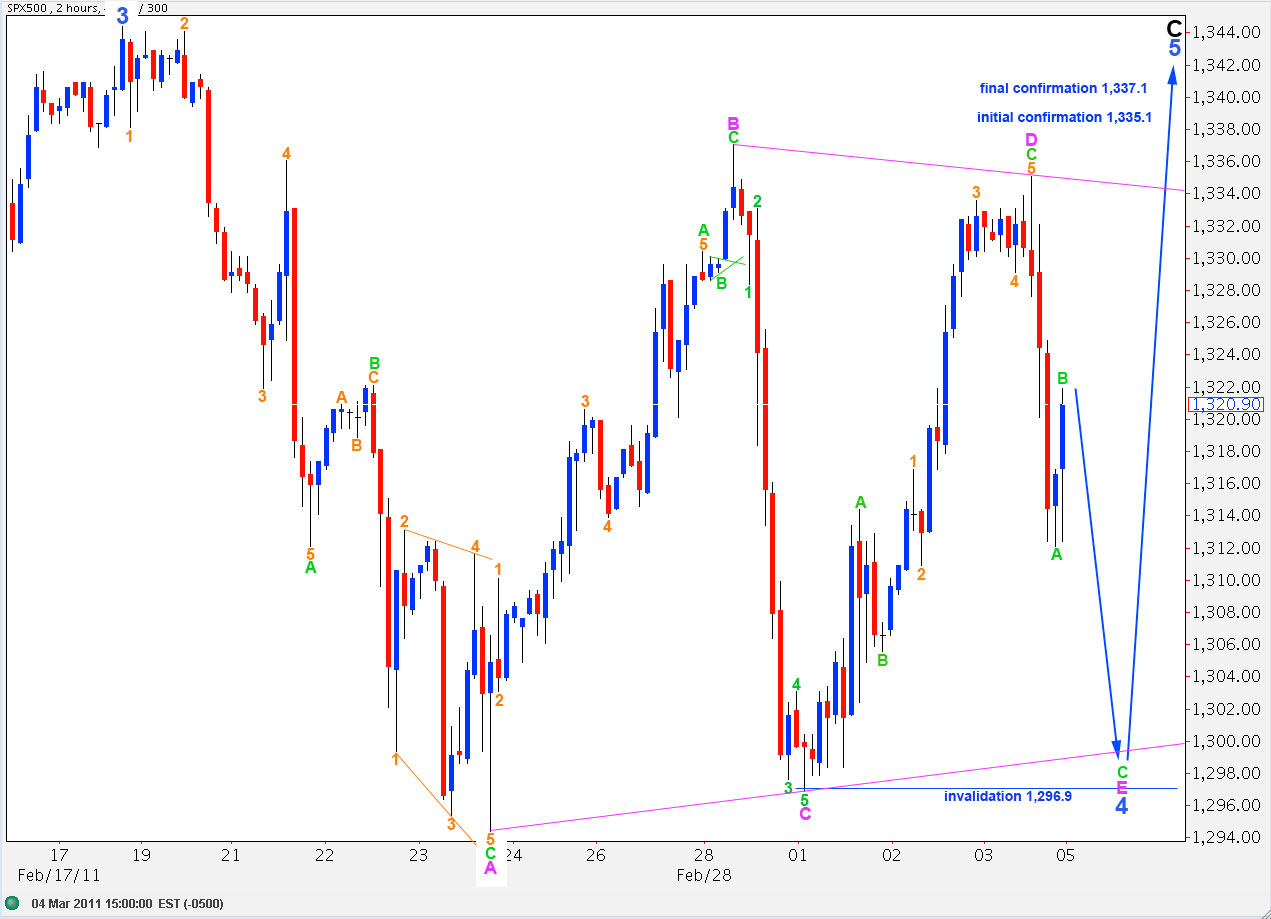
We now have a 1-2, 1-2 downwards on the hourly chart. This expects a very strong third wave down to begin very soon.
We need to see movement below 1,294.4 to invalidate the alternate wave count and provide confidence in a trend change. We shall have full confirmation of a trend change when we see movement below the wide blue parallel channel on the daily chart.
This wave count is invalidated with movement above 1,335.1. If upward movement invalidates this wave count we should use the alternate wave count below.
Alternate Wave Count.
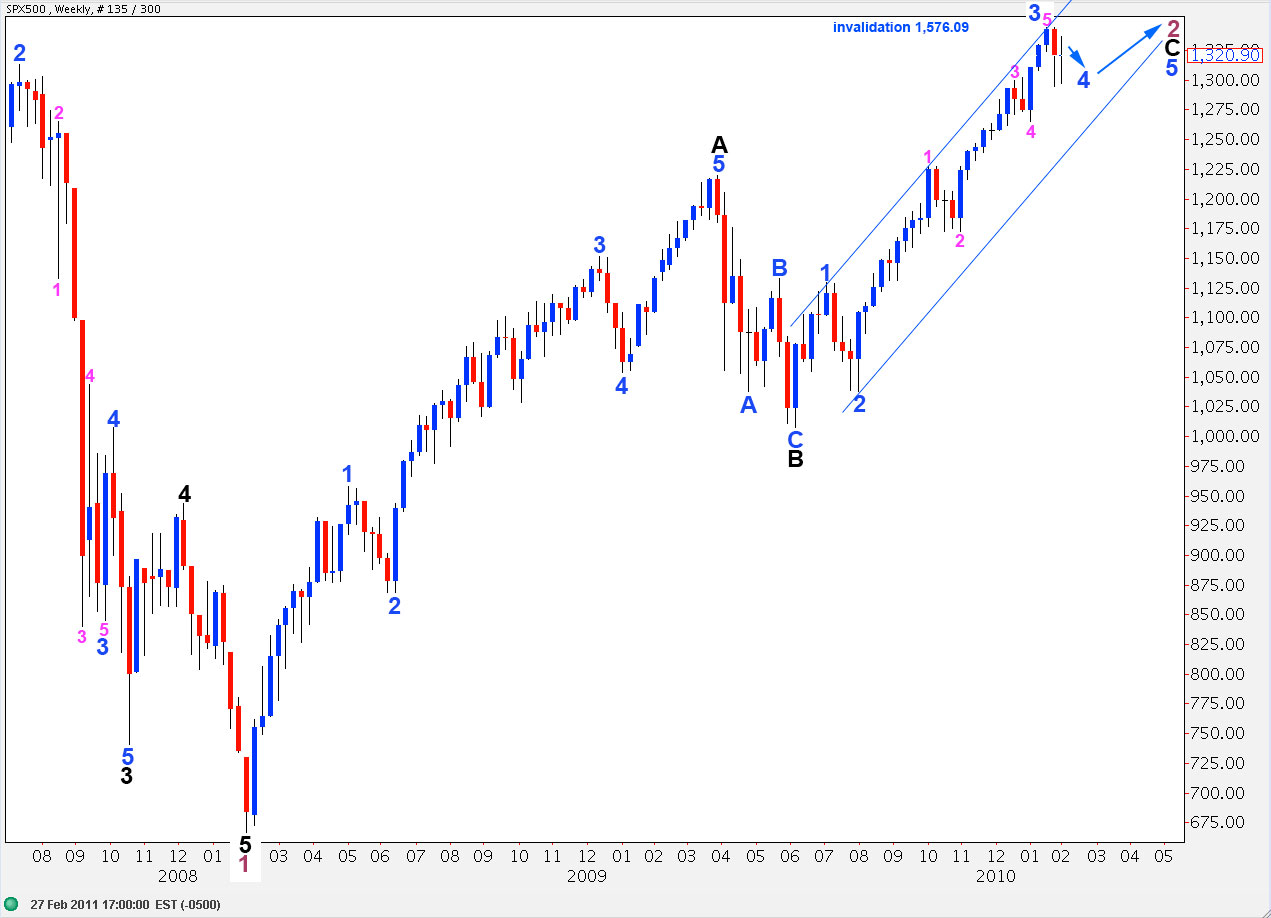
In order to see a valid alternate which has a good look we have to alter the degree of labeling from the low labeled 2 blue, which is the entire daily chart at this time. This weekly chart puts this wave count in context.
The invalidation point at 1,576.09 is the beginning of primary wave 1 which is off to the left of the chart. Wave C black may continue upward to reach equality with wave A black at 1,561.2.
Within wave C black wave 3 blue is 13 points short of 2.618 the length of wave 1 blue.
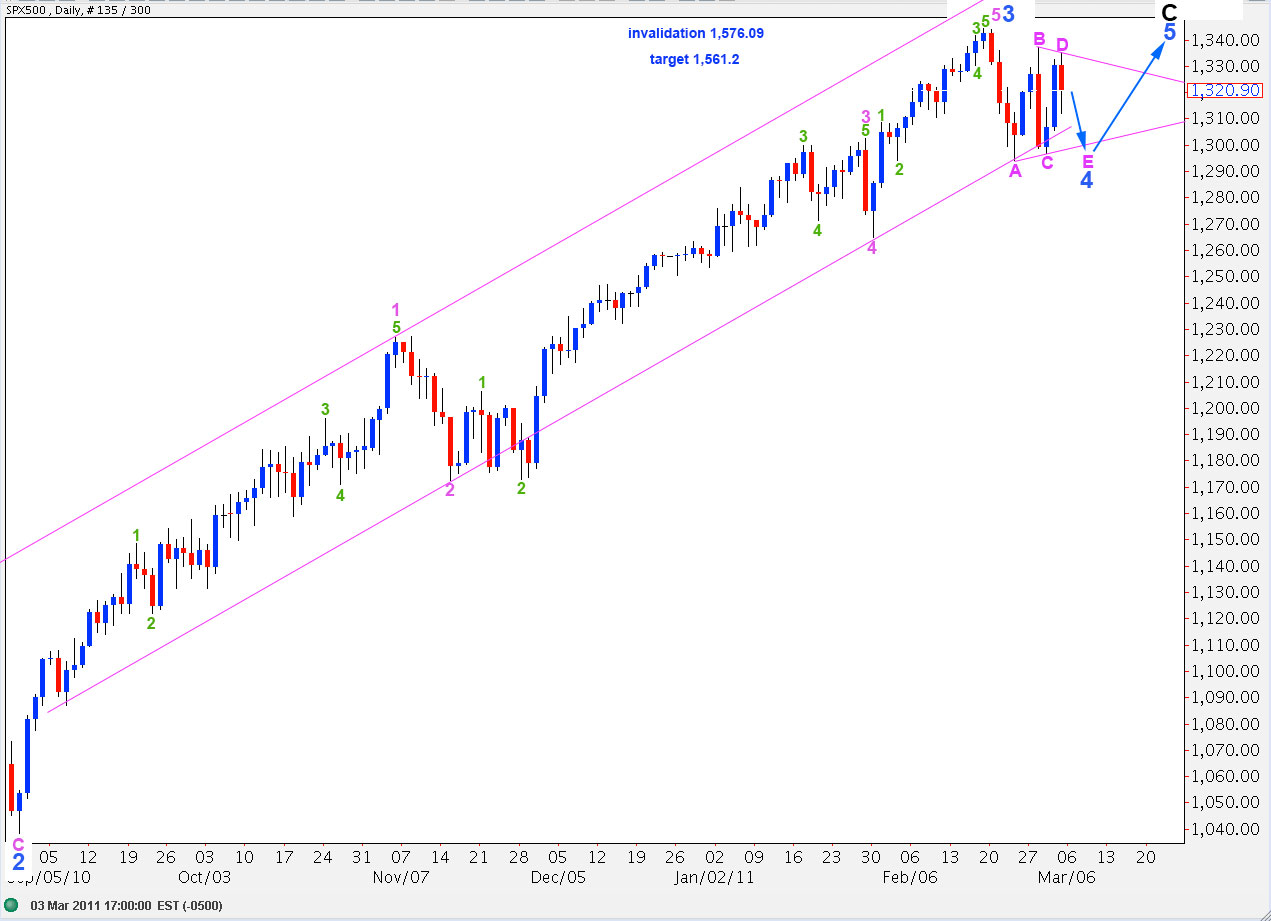
This daily chart shows the whole of wave 3 blue. The S&P may be completing a triangle for a fourth wave at minor (blue) degree.
Ratios within wave 3 blue are: pink wave 3 is 10.5 points longer than 0.618 the length of pink wave 1 and pink wave 5 is just 0.6 points longer than 0.618 the length of pink wave 3.
Within wave 1 pink of wave 3 blue there are no adequate fibonacci ratios nor relationships of equality between green waves 1 (110.2 points), 3 (74.2 points), and 5 (56.3 points).
Ratios within wave 3 pink of wave 3 blue are: wave 3 green has no fibonacci ratio to wave 1 green and wave 5 green is just 3 points short of equality with wave 1 green.
The subdivisions seen here for wave 5 pink of wave 3 blue are the same as for wave 5 pink of wave 5 blue on the main wave count. Therefore, they are identical.
Ratios within wave 5 pink of wave 3 blue are: wave 3 green is 2.8 points short of 0.618 the length of green wave 1 and green wave 5 is 3.4 points short of 0.618 the length of green wave 3.
The possible triangle for wave 4 at blue (minor) degree is shown here on a 2 hourly chart.
Four of the five waves of a triangle must subdivide into zigzags or triangles themselves (in the case of wave E). Therefore, to see wave C pink of this triangle as an impulse is acceptable and it does not violate any rules.
We should expect one of the waves of a triangle is likely to be 0.618 the length of its predecessor. Wave E pink will reach 0.618 the length of wave D pink at 1,311.5.
Movement below 1,296.9 would invalidate this triangle interpretation. However, we need movement below 1,294.4 to fully eliminate a triangle scenario due to the different interpretation below.
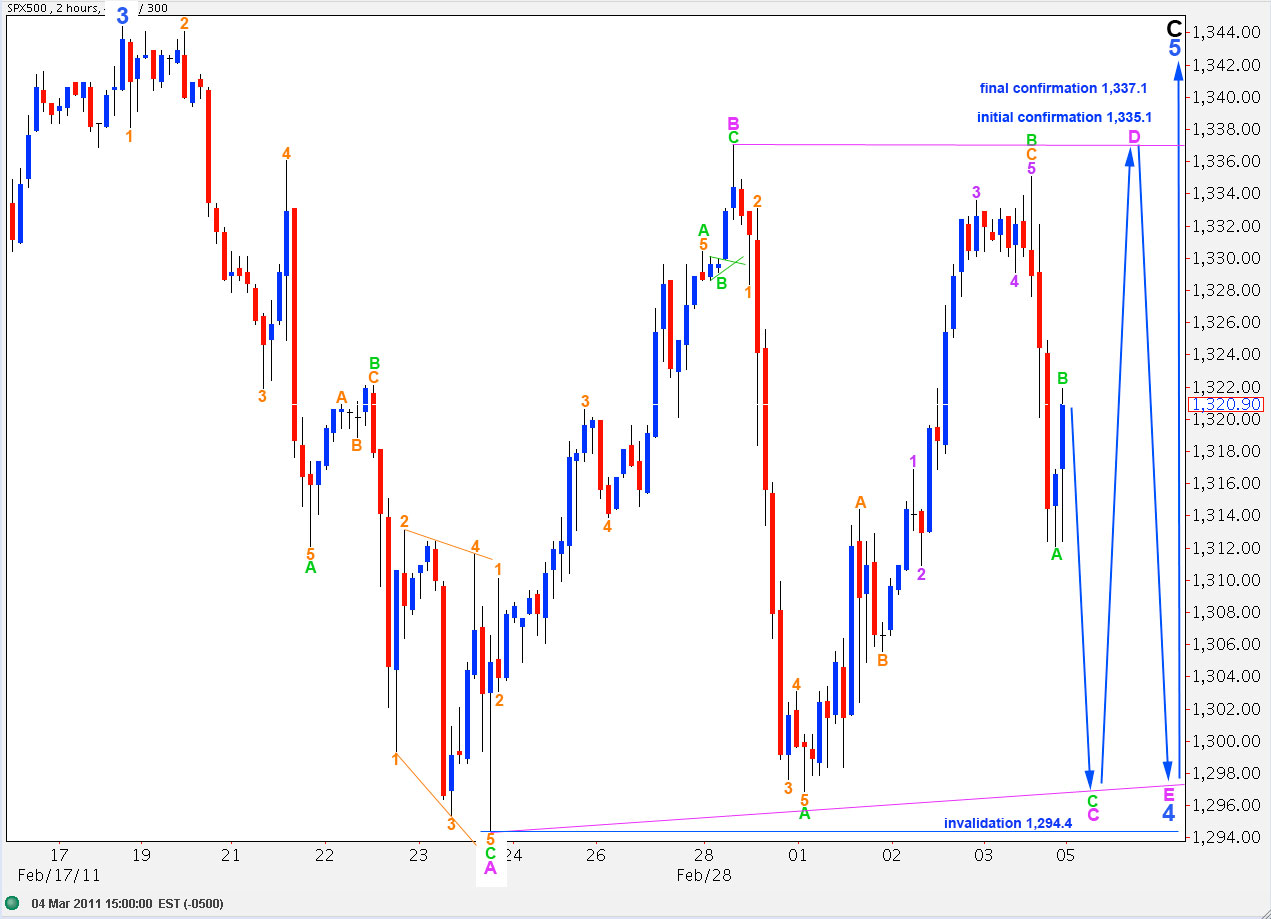
We should expect one of the subwaves of a triangle to be longer lasting than the others. This is normally wave C or D. Therefore, we must consider the possibility that wave C is incomplete.
This sees the downward wave labeled here A green of C pink as an impulse, which fits nicely.
The lengths of the waves of this triangle seem too deep. We should expect the triangle trend lines to converge more than they do here. The B-D trend line may be flat as for a barrier triangle, but the lower A-C trend line should slop upward more than it does for both triangle interpretations.
In conclusion, this is a valid alternate. However, the fibonacci ratios are not as good as the main wave count and the triangle has a slightly odd look. Therefore, this wave count has a lower probability than the main wave count.
We should wait for movement either above 1,337.1 or below 1,294.4 to provide clarity.