
Elliott Wave chart analysis for the SPX500 for 1st March, 2011. Please click on the charts below to enlarge.
The S&P is behaving pretty much as expected. We have seen a sheer drop during Tuesday’s session for the 1st of March which is exactly what we should see for a third wave down. It’s not over yet.
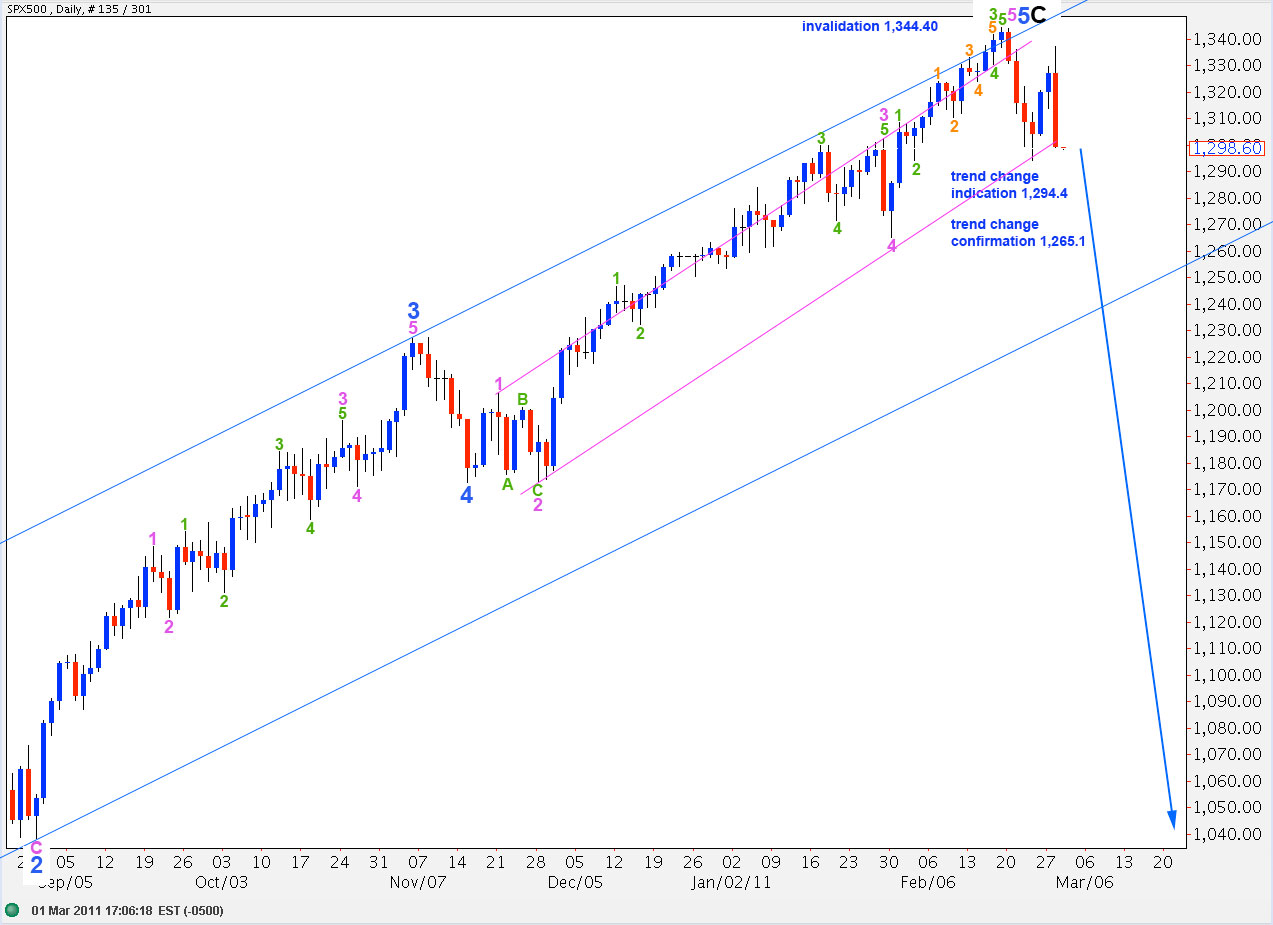
If this is a third wave then one more day’s trading should give us a candlestick below the smaller pink channel on the daily chart, drawn about wave 5 blue impulse. That will provide a strong indication of a trend change. It is likely also to take price below 1,265.1 which may be considered confirmation of a trend change.
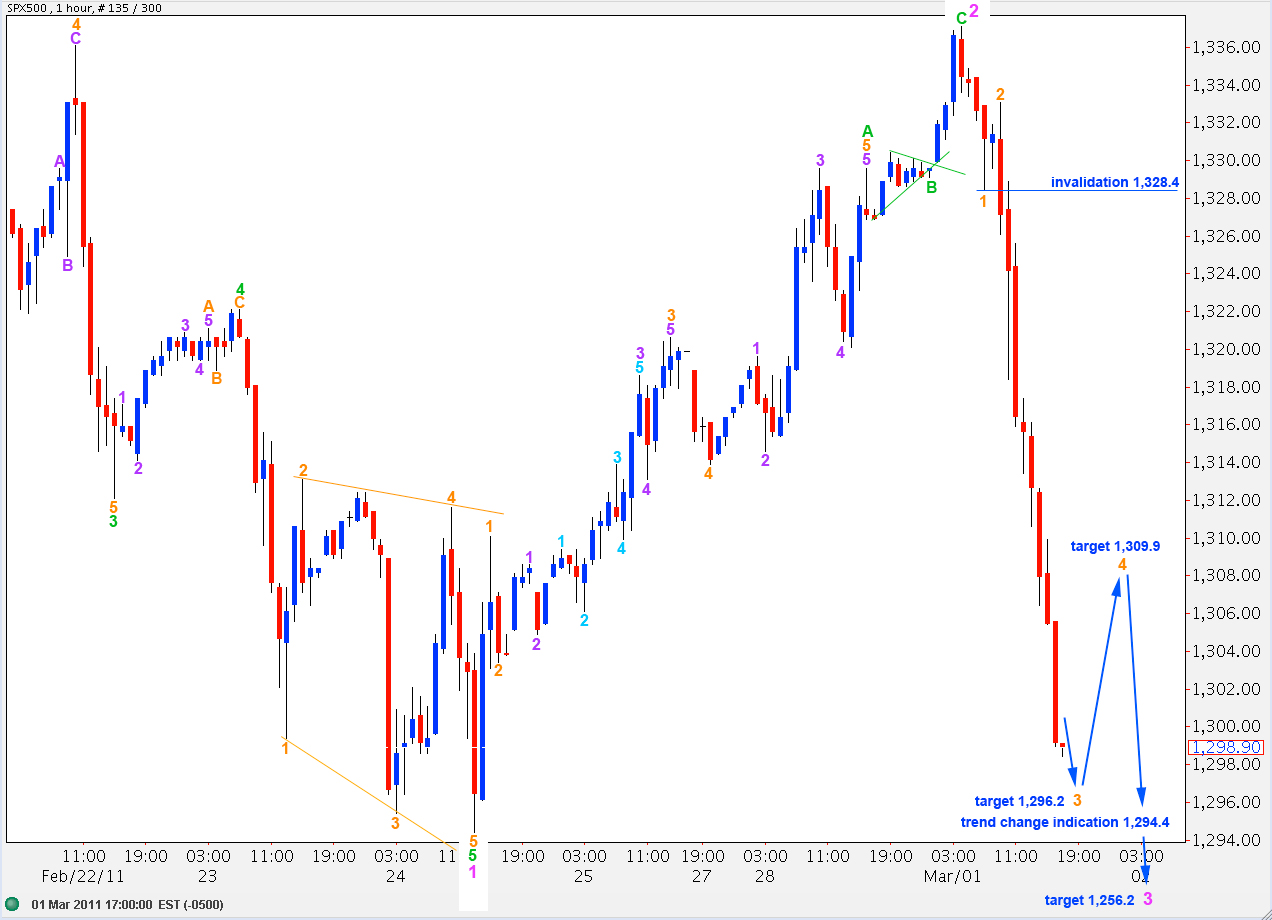
We expected wave 2 pink to end higher and it did. However, we were expecting a B wave within it to give wave 2 pink a three wave look but that did not occur. We can see a B wave in there as a small triangle, and wave 2 pink has a corrective wave count, but it does not have the exaggerated three wave look we were expecting.
Downward movement is a strong third wave, which is exactly what we were expecting to see when wave 2 pink was over. Wave behaviour is certainly conforming to this wave count nicely.
At 1,256.2 wave 3 pink will reach 1.618 the length of wave 1 pink.
In the short term wave 3 orange will reach 4.236 the length of wave 1 orange (it has already passed 2.618 the length of wave 1 orange) at 1,296.2. We should expect a fourth wave correction about that point. Draw a fibonacci retracement from the high labeled 2 orange at 1,333.1 to the low of 3 orange and expect the fourth wave bounce to correct to the 0.382 fibonacci ratio most likely, particularly if it is close to the fourth wave of one lesser degree which is at 1,309.9.
The following fifth wave should take price below 1,294.4 giving us more confidence in a trend change. If wave 5 orange reaches equality with wave 1 orange then it may be truncated, which is unlikely. Wave 5 orange may be about 14.08 points in length.
We can see a clear contrast between upward movement, which is choppy and overlapping, compared to downward movement, which is clear and strong.
We should expect probably one or possibly two more days to give us the confirmation of a trend change that we seek. At that stage we must look out for corrections which may be deep and swift.
If this is primary wave 3 in its very early stages then it should eventually take price below 666.8, to new lows. When the trend change is confirmed I will calculate long term targets for you.