
Elliott Wave chart analysis for the SPX500 for 24th February, 2011. Please click on the charts below to enlarge.
As expected the S&P has moved lower but not nearly as much as we were anticipating for Thursday’s session. Price has remained below the first invalidation point on the hourly chart.
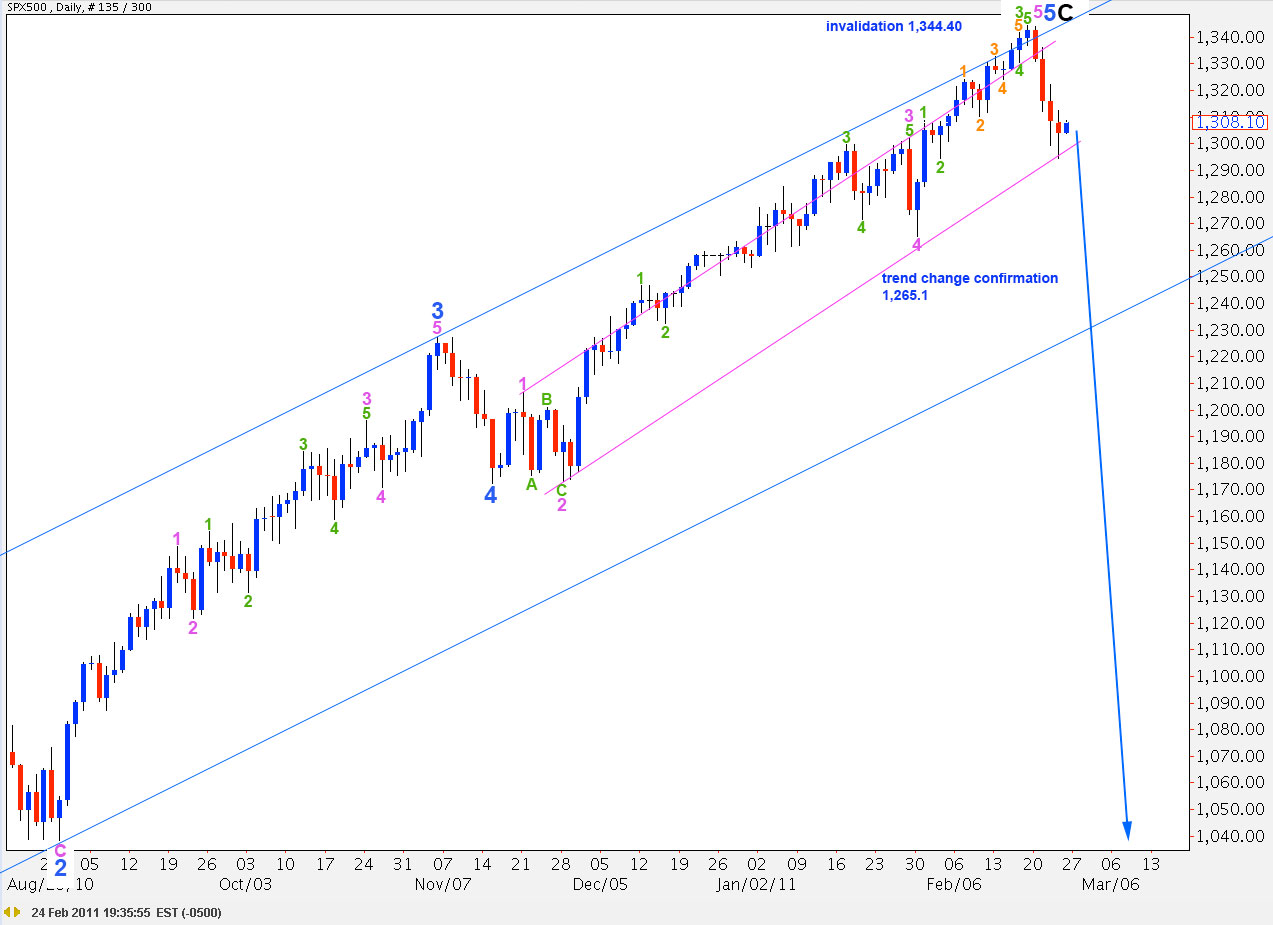
We should still exercise patience for a few more days to see this trend change confirmed (or invalidated). Price movement below 1,265.1 and below the pink parallel channel here on the daily chart will provide a lot of confidence that we have seen a trend change.
If this is the very early stages of primary wave 3 to the downside then we should expect a rough ride down. We may see strong downward movement with equally strong and deep upward corrections along the way. Primary wave 3 may be difficult to analyse and difficult to trade.
Primary wave 3 must move beyond the end of primary wave 1. Therefore, it must take price below 666.8 eventually.
When we have a trend change confirmed then I will calculate downward targets for you. To do so at this stage would be premature.
Movement above 1,344.4 would invalidate this wave count.
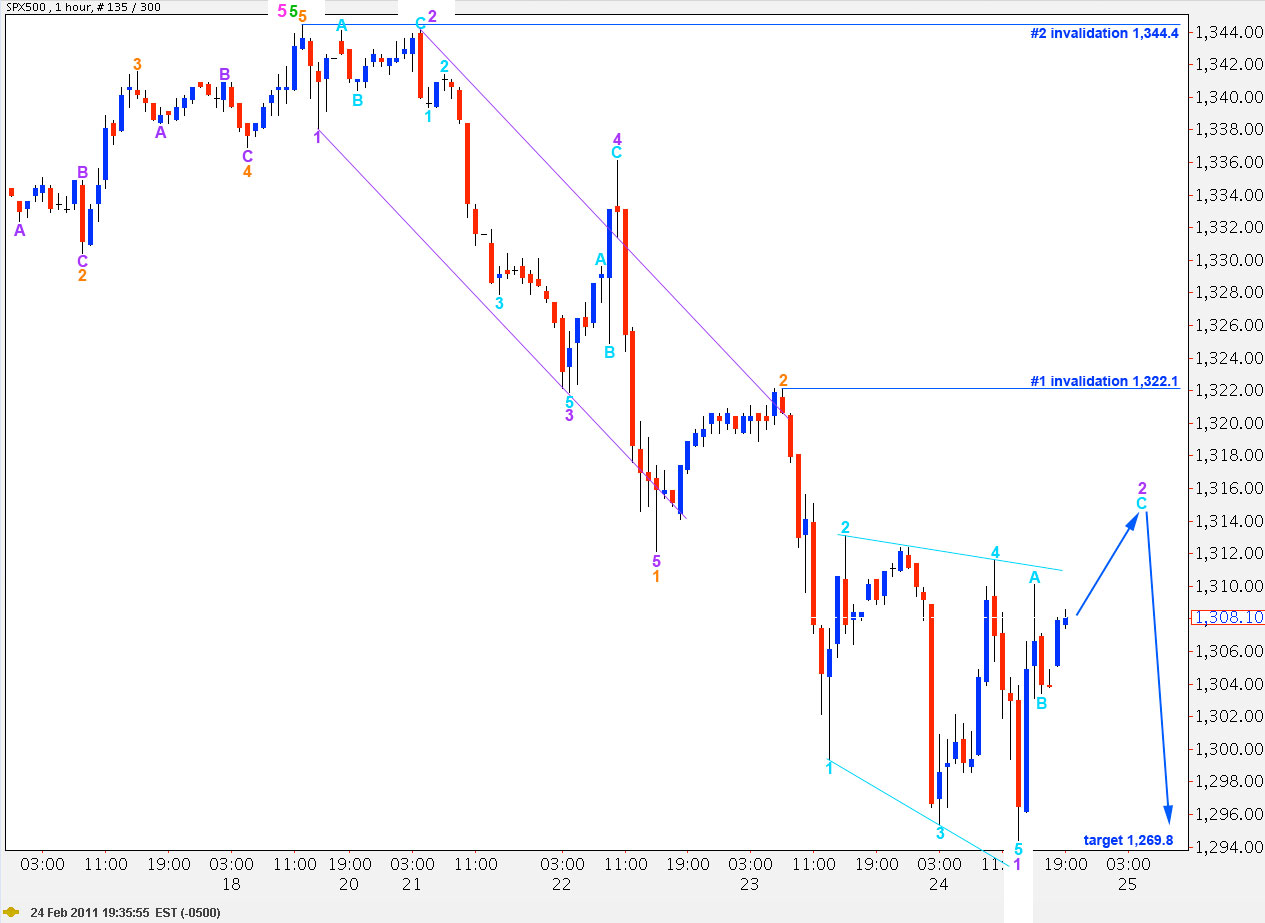
We are at a critical juncture in the next day or two with the S&P. At this stage downward movement may be seen as a three wave structure: A-B-C with C an ending diagonal where I have purple 1 label.
We need to see a new low below 1,294.4 to see this downward movement develop into a five to have more confidence in a trend change. The next wave down may take price below 1,265.1 giving us confirmation of a trend change.
Movement above 1,322.1 would invalidate this wave count as wave 2 purple may not move beyond the start of wave 1 purple. At that stage a trend change would be in serious doubt and we may expect to see new highs most likely.
At this stage I have not managed to see an alternate which has nearly as good a look as this wave count. The best alternate I can see simply moves the degree of labeling within the whole of wave 5 pink all down one degree, and downward movement would therefore be a second wave correction: wave 2 green within wave 5 pink. It is just technically possible but it has a horrible look.
It is most likely that we shall see continuing downward movement from the S&P when this small second wave correction for wave 2 purple is complete. This may happen in the next one or two days trading sessions.