
Elliott Wave chart analysis for the SPX500 for 18th February, 2011. Please click on the charts below to enlarge.
As expected the S&P continues to slowly rise, getting closer each day to our target zone.
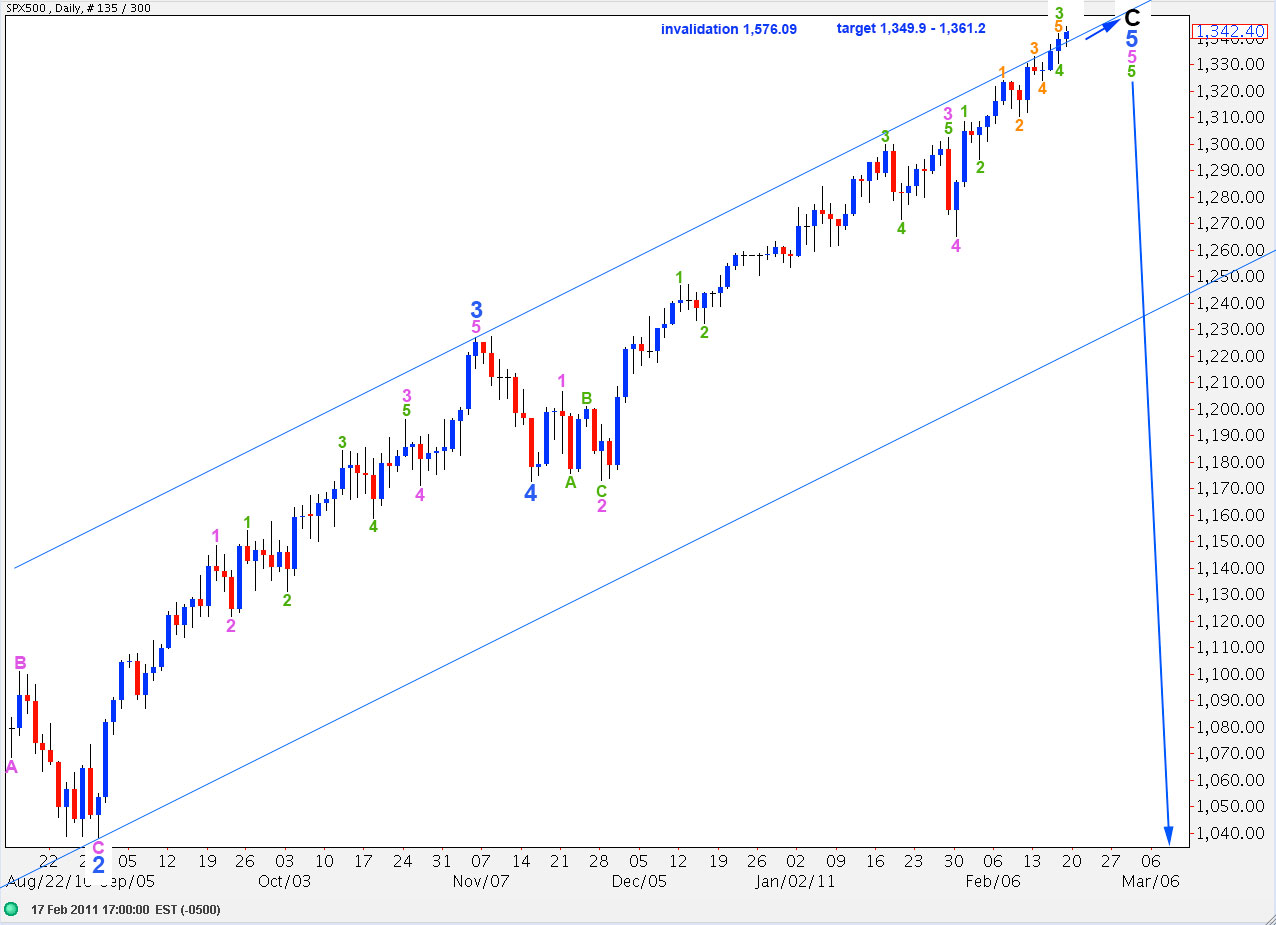
At 1,349.9 wave C black will reach 0.618 the length of wave A black. At 1,361.2 wave 5 blue will reach equality with wave 3 blue. Within this target zone, at 1,357.3 wave 5 green within wave 5 pink of 5 blue will reach 0.618 the length of wave 1 green. There is a cluster of targets in this 11.3 point wide zone. We may expect upward movement to end within it, and I favour 1,349.9 over 1,357.3 because there is already a nice fibonacci ratio between waves 3 and 1 blue (3 blue is just 8.6 points short of 1.618 the length of 1 blue).
This main wave count is invalidated with movement above 1,576.09. We should not see new highs for the S&P. However, if price reaches up to 1,485.16 then our alternate historical wave count will be valid and we may then expect new highs are most likely.
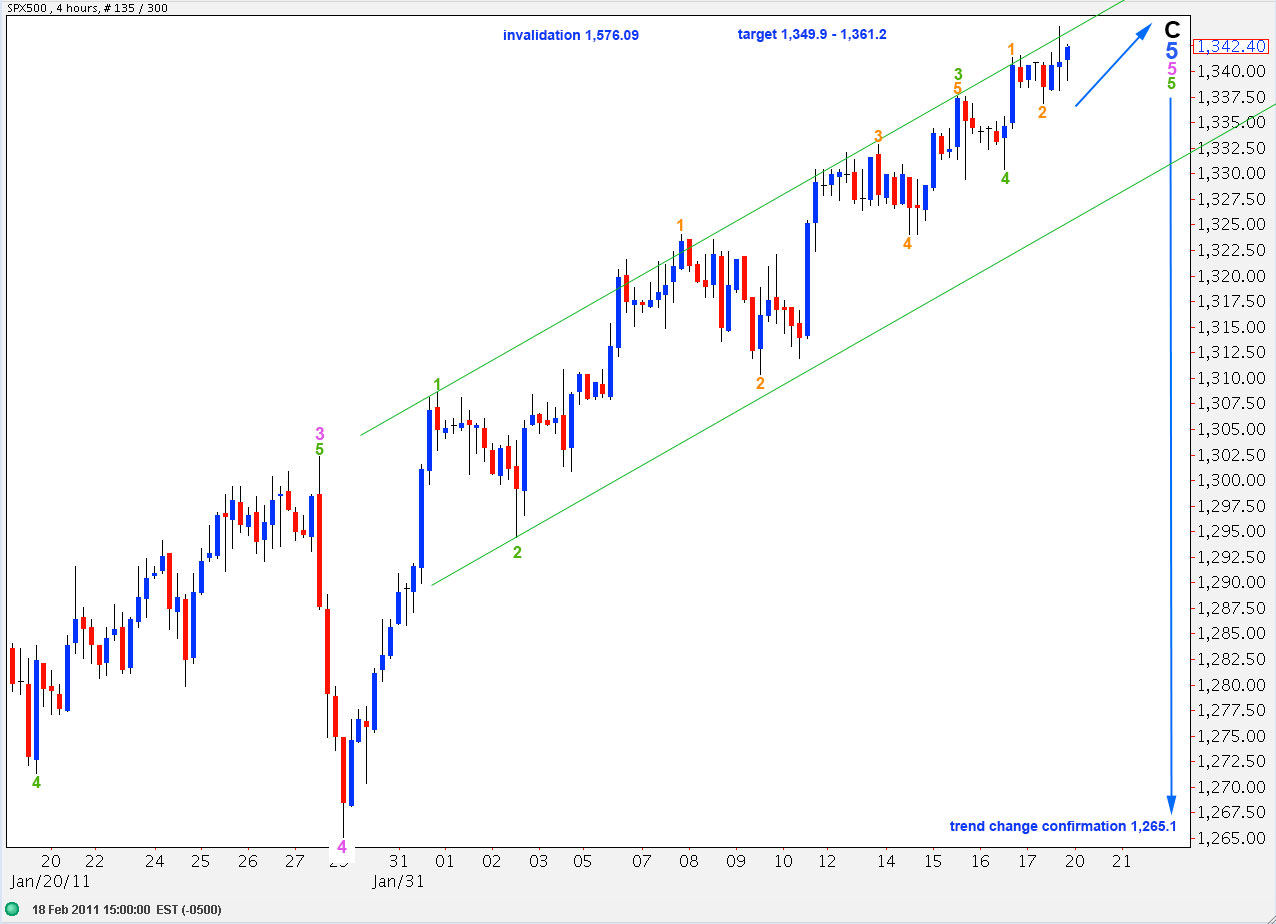
At this critical juncture I will continue charting this 4 hourly wave count for you so that we have a clear idea of the wave structure for this fifth wave at minor (blue) degree.
Wave 3 green is 0.3 points shorter than wave 1 green in length. Therefore, wave 5 green has a maximum length at 1,373.6.
Ratios within wave 3 green are: wave 3 orange has no fibonacci ratio to wave 1 orange and wave 5 orange is just 0.4 short of 0.618 the length of wave 3 orange.
We now most probably have an end to the first orange wave within wave 5 green. Wave 3 orange may be unfolding as an extended wave.
Price remained above the invalidation point for last analysis and as expected continued to move slowly higher.
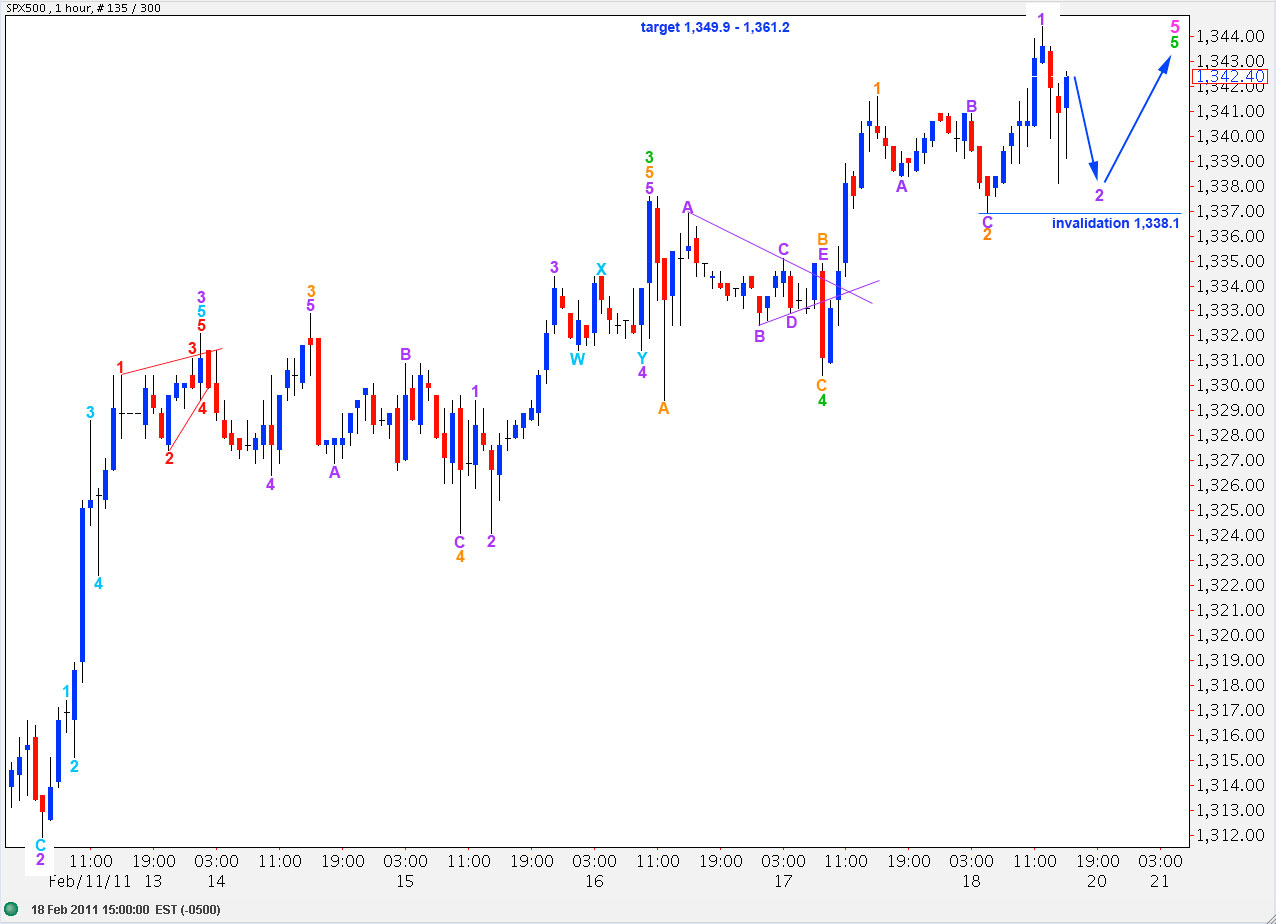
If labeling of most recent movement is correct then price should stay above 1,338.1 as wave 2 purple within wave 3 orange may not move beyond the start of wave 1 purple.
Wave 3 orange is most likely unfolding as an extended wave. At 1,355.02 it will reach 1.618 the length of wave 1 orange. This suggests an end to upward movement higher in our target zone.
When wave 2 purple is viewed on a 15 minute chart a five down movement and then a three up movement can be seen. Therefore, it is most likely not over yet and needs another five down before it is complete.
Thereafter, we should see a resumption of upward movement to take price into the target zone.
We can see clear divergence with price trending higher as MACD trends lower on 4 hourly, 1 hourly and 15 minute charts. This fits with our wave count which sees the third wave within 5 green as over and a terminal fifth wave completing.