
Elliott Wave chart analysis for the SPX500 for 17th February, 2011. Please click on the charts below to enlarge.
We have just the one wave count today. Upward movement invalidated the alternate wave count for yesterday. It is most likely there is still further upward movement to go.
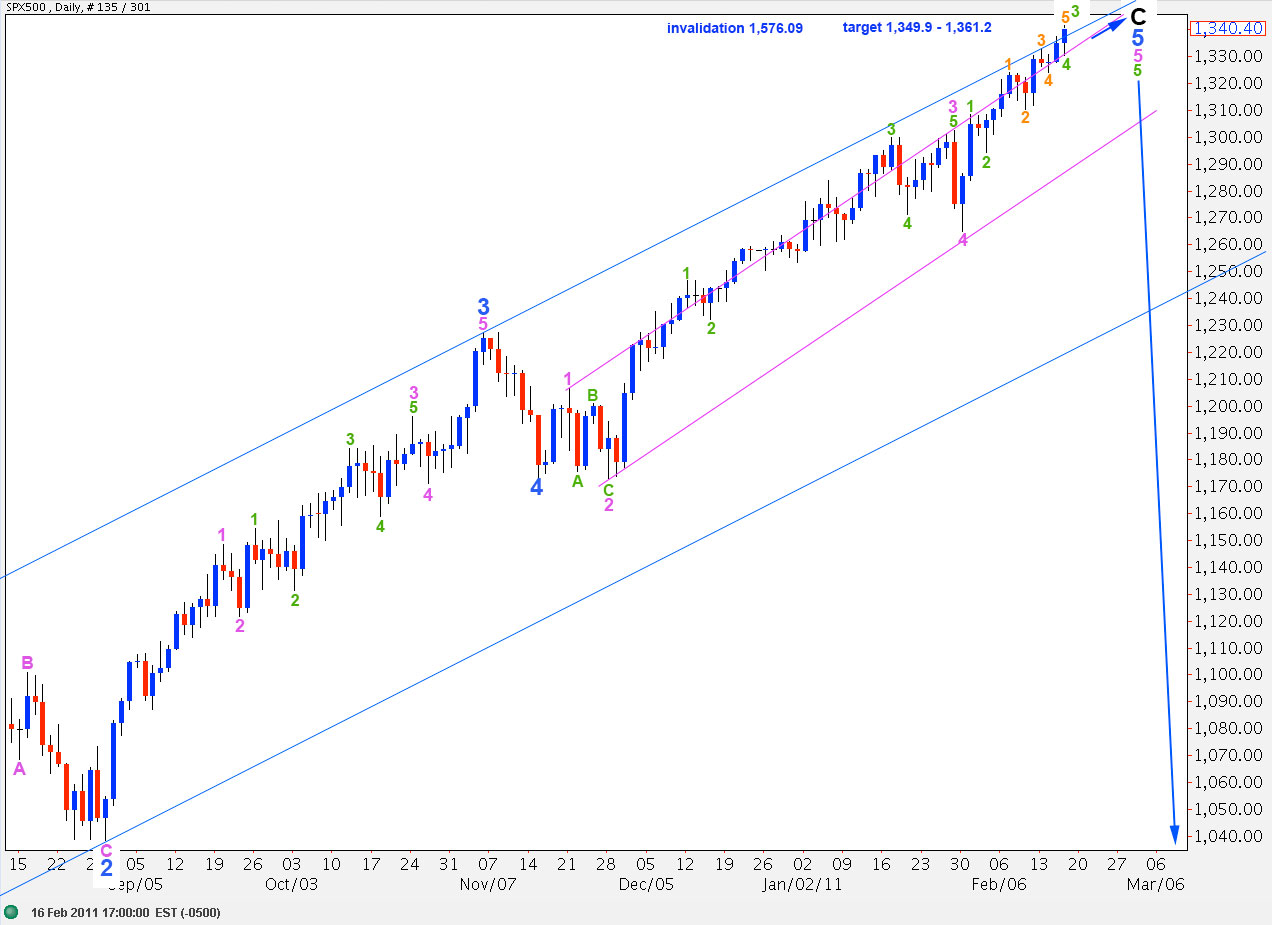
It is increasingly likely that the long held target of 1,349.9 may be reached, where wave C black will reach 0.618 the length of wave A black.
We most likely still have a few more days to go of upward movement before the S&P is ready to turn.
At 1,361.2 wave 5 blue will reach equality with wave 3 blue.
This main wave count is invalidated with movement above 1,576.09. We should not see new highs for the S&P.
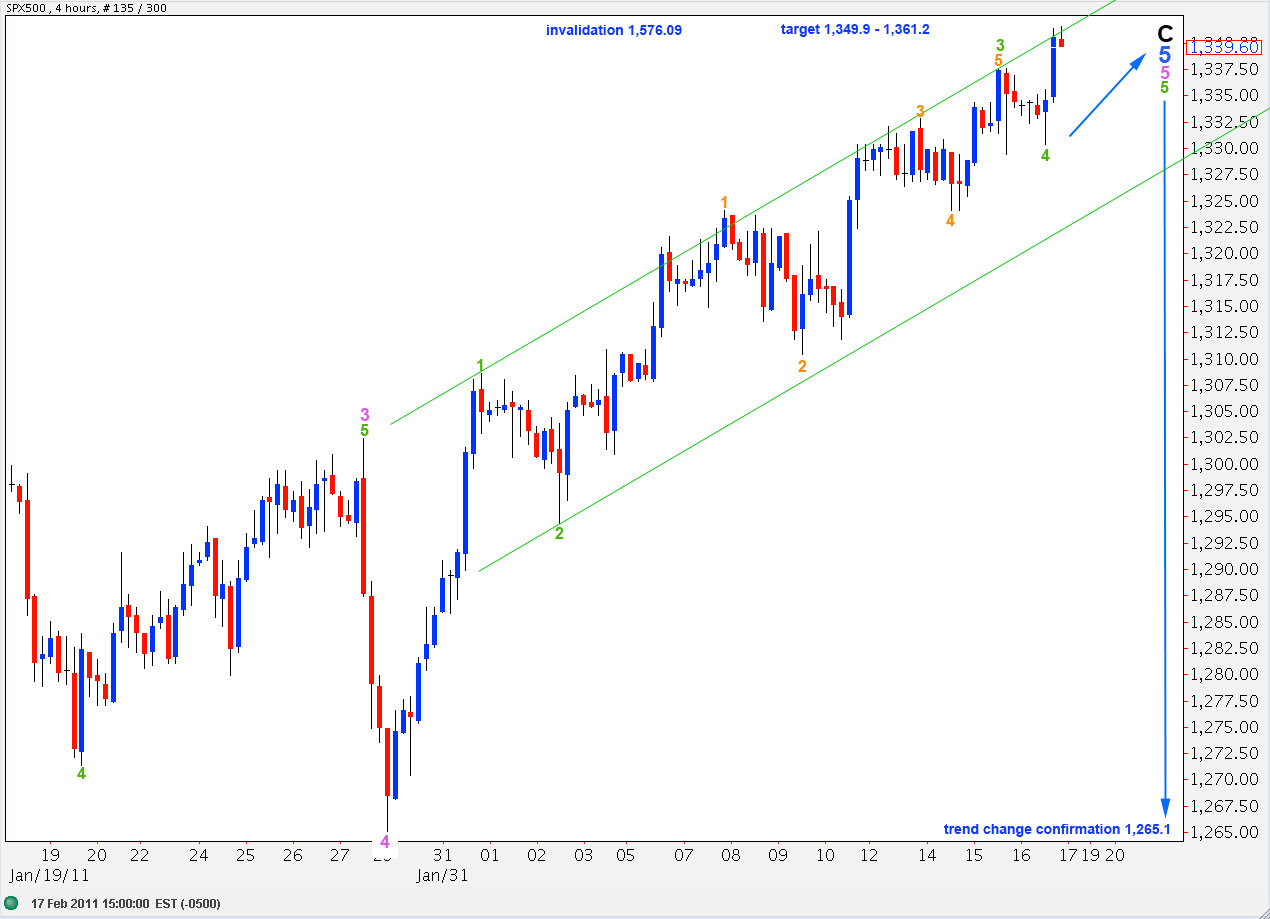
This 4 hourly chart details all of our wave count for wave 5 pink so far.
Wave 3 green is 0.3 short of equality with wave 1 green. Therefore, wave 5 green may not be longer than wave 1 green. It would reach its maximum length at 1,373.6.
At 1,357.3 wave 5 green will reach 0.618 the length of wave 3 green. This point is within the target zone, increasing the probability of a turning point being reached within this zone.
Ratios within wave 3 green are: wave 3 orange has no fibonacci ratio to wave 1 orange and wave 5 orange is just 1 point longer than 0.618 the length of wave 3 orange.
We should draw a trend channel on the 4 hourly chart around wave 5 pink using Elliott’s technique. When this channel is breached and we see movement below it we shall have our very first indication of a trend change.
Movement below 1,265.1 (the start of wave 5 pink) is a strong indication of a trend change. At that stage downward movement may not be just a second wave correction within wave 5 pink as wave 2 may not move beyond the start of wave 1. At that stage wave 5 pink would have to be over. I would not want to place the label for wave 4 pink anywhere else on this upward movement; it has its best fit here.
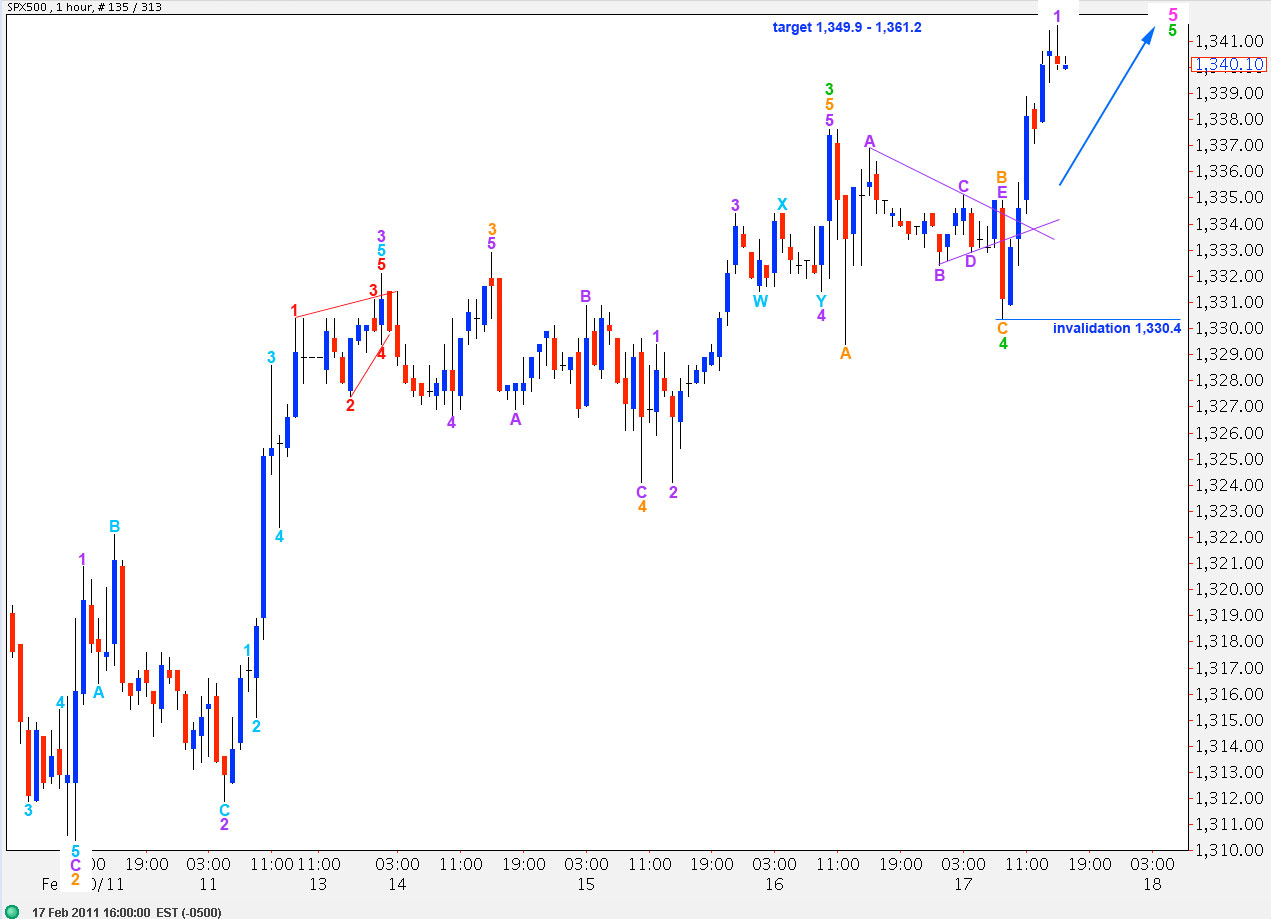
The target for wave 4 green to end was at 1,328.7. It has ended 1.7 points short of this target at 1,330.4 with a truncated C wave. There is no fibonacci ratio between waves A and C orange within wave 4 green.
Thereafter, as expected for this main wave count, we saw some further upward movement.
It is unlikely that wave 5 green was so brief and short. Therefore, it is not likely that upward movement is over.
We should expect further upward movement from the S&P.
Wave 2 purple may not move beyond the start of wave 1 purple. Therefore, this hourly wave count is invalidated with movement below 1,330.4.