
Elliott Wave chart analysis for the SPX500 for 15th February, 2011. Please click on the charts below to enlarge.
Movement below 1,326.4 has invalidated the hourly wave count. We were expecting further upward movement from the S&P and we did not get this.
I have three hourly wave counts for you today. Two expect further upward movement and one of these expects continuing long drawn out upward movement before a high is in place.
The third wave count must be considered because we again can see a satisfactory complete structure at all wave degrees and upward movement may have been over at 1,332.9. As always, we should assume that the trend remains the same, until it is proved otherwise. At this stage movement below 1,265.1 would provide strong confirmation of a trend change.
Main Hourly Wave Count.
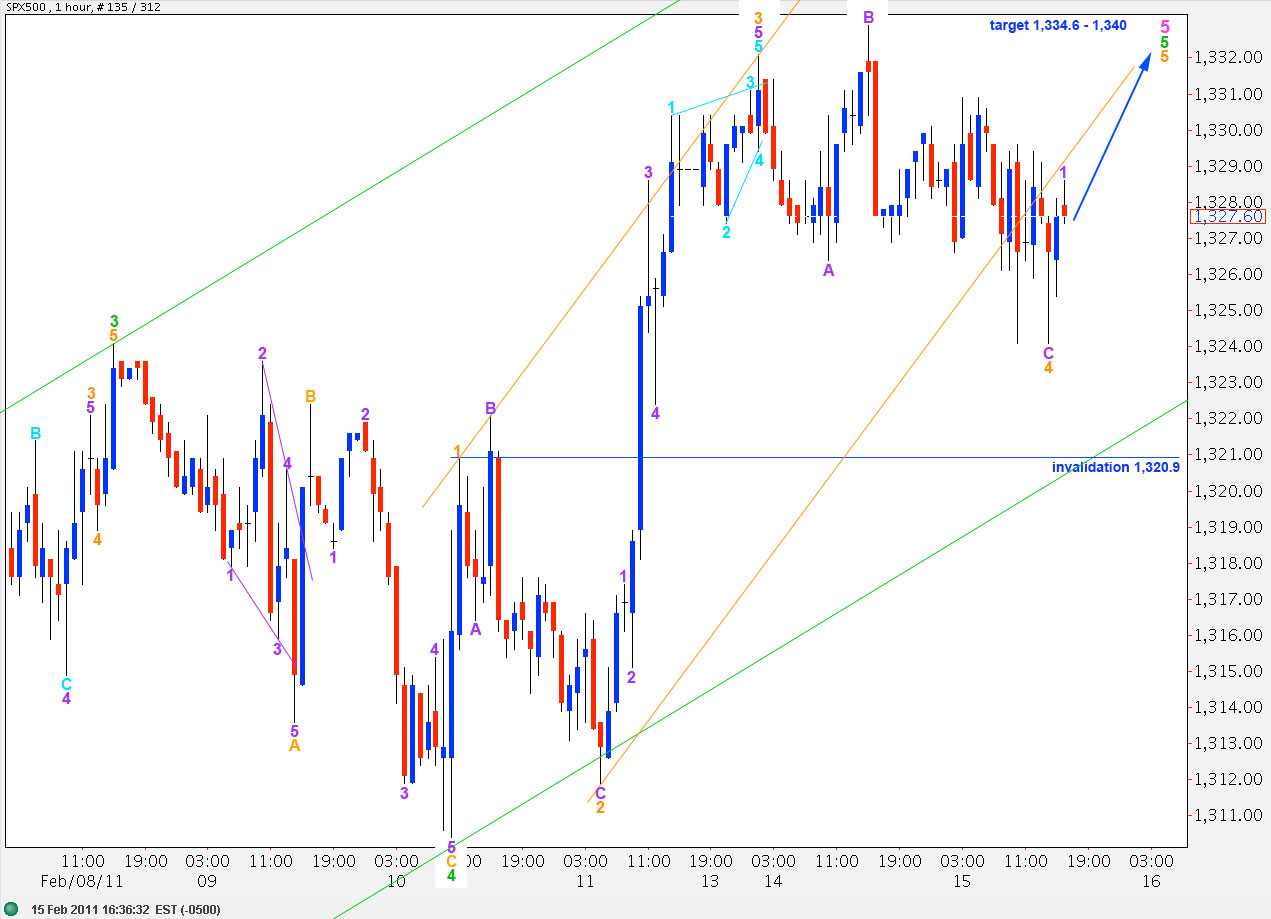
Yesterday’s downward movement may have been a fourth wave at orange degree.
This wave count requires only one final upward wave toward the target zone to complete a satisfactory structure at all wave degrees.
There is no fibonacci ratio between waves 3 and 1 orange. If wave 5 orange reaches equality with wave 1 orange this will end about 1,334.6.
Wave 3 green is shorter than wave 1 green. Therefore, wave 5 green has a maximum length at equality with wave 3 green at 1,340.
Any further downward extension of wave 4 orange may not move into wave 1 orange price territory. Therefore, this wave count is invalidated with movement below 1,320.9.
First Alternate Hourly Wave Count.
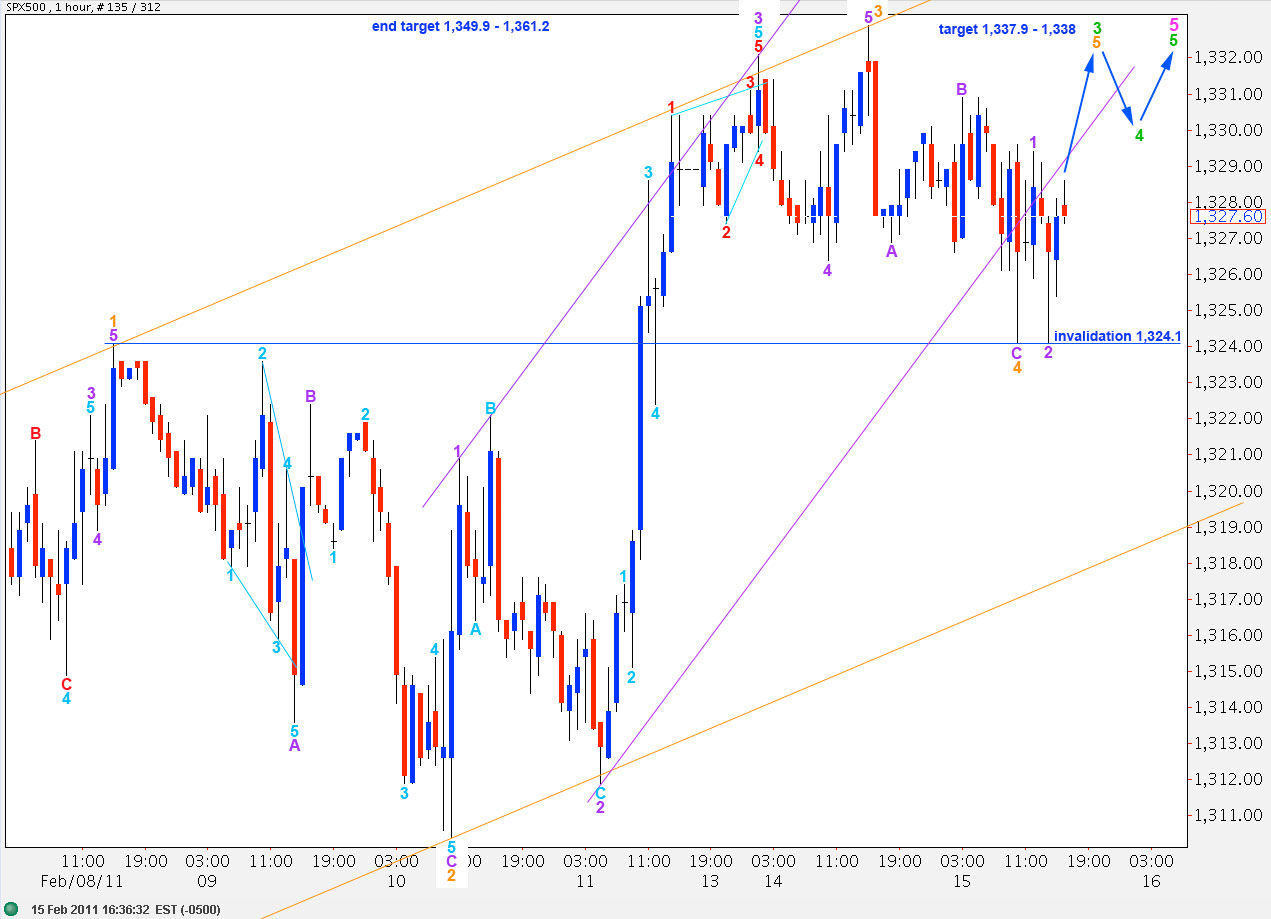
Yesterday’s unexpected downward movement found resistance and ended at 1,324.1, which is the high of wave 1 orange.
This wave count differs mostly from the main wave count in that wave 3 green here is incomplete and may not end up being shorter than wave 1 green.
Wave 3 green will reach equality with wave 1 green at 1,337.9.
Within wave 3 green, wave 3 orange is a nice impulse with the strongest upward momentum, and this wave count fits wave behaviour better than the main. Wave 3 orange is close to equality with wave 1 orange, it is 7.2 points shorter. Therefore, wave 5 orange has a maximum length as equal to three at 1,346.6. At 1,338 wave 5 orange will reach 0.618 the length of wave 3 orange. Therefore, the upward target for the next wave up is 1,337.9 to 1,338.
Thereafter, another fourth wave correction, this time at green degree, may not move price below the high of wave 1 green at 1,308.6.
A final upward wave toward the end target would end upward movement.
This wave count allows for a longer more drawn out end to this whole movement; a high may yet be another two weeks or so away.
Second Alternate Hourly Wave Count.
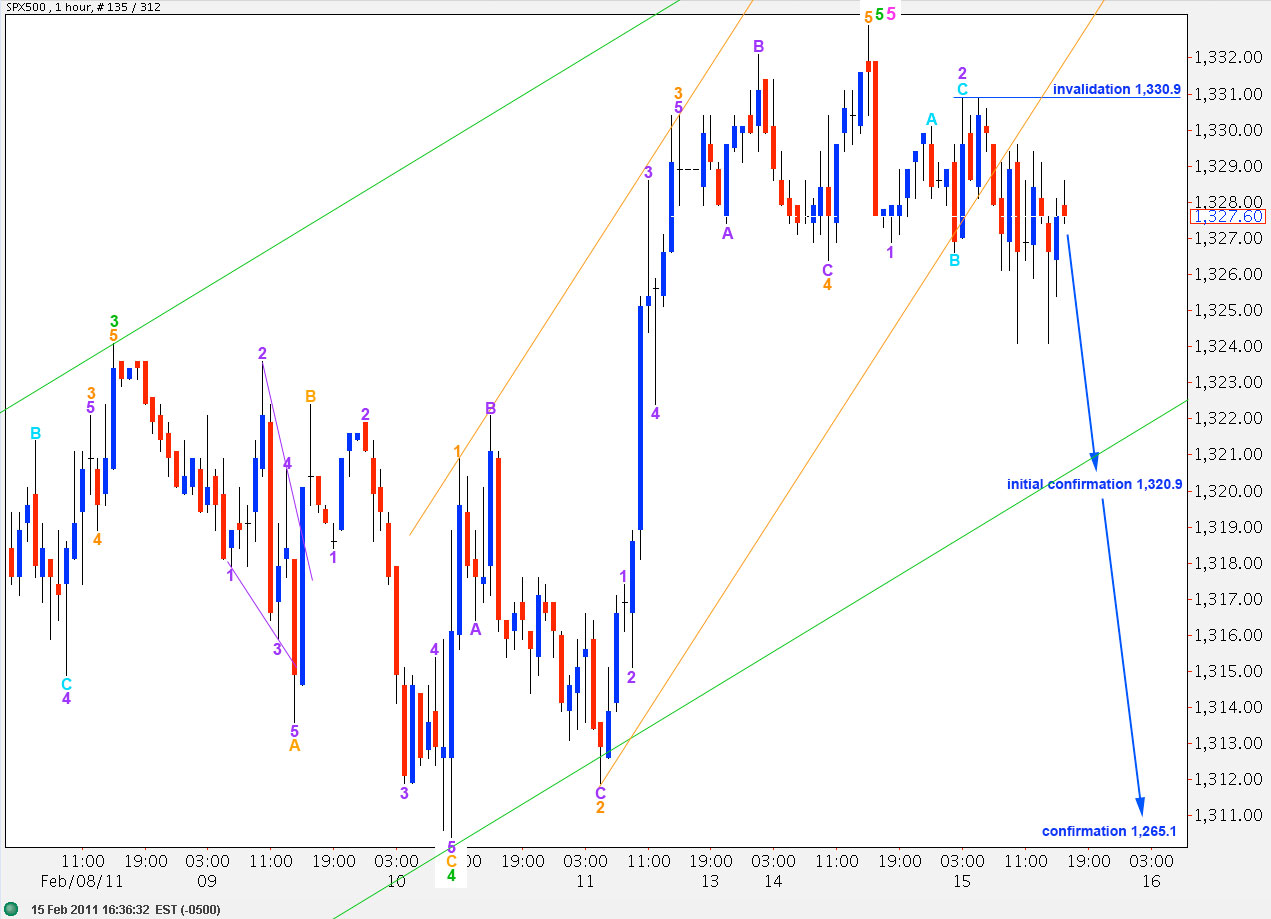
We must consider this possibility.
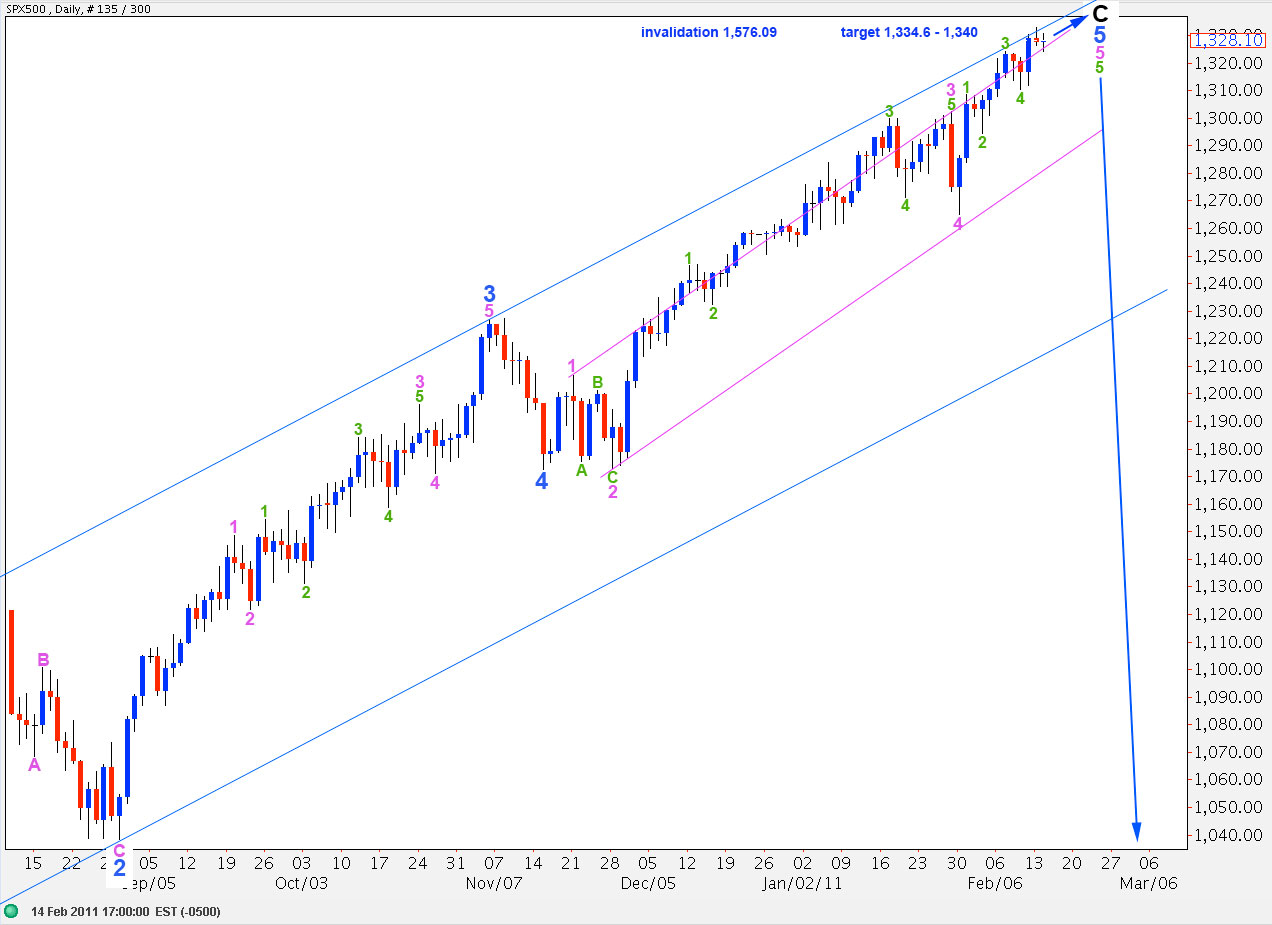
If upward movement is over then ratios are:
Black wave C is just 17 points short of 0.618 the length of black wave A.
Ratios within wave C black are: wave 3 blue is 8.6 points short of 1.618 the length of wave 1 blue and there is no fibonacci ratio between wave 5 blue and either of 1 or 3.
Ratios within wave 5 blue are: wave 3 pink is 15 points short of 4.236 the length of wave 1 pink and there is no fibonacci ratio between wave 5 pink and either of 1 or 3.
Ratios within wave 5 pink are: wave 3 green is 2.8 points short of 0.618 the length of wave 1 green and wave 5 green is 7.2 points short of equality with wave 3 green.
Ratios within wave 5 green are: wave 3 orange is 1.5 points longer than 1.618 the length of wave 1 orange and wave 5 orange is exactly equal in length to 0.618 the length of wave 1 orange.
We would initially need to see movement below 1,320.9 to indicate this wave count may be correct, invalidating the main wave count.
We would need to see the green channel on the hourly chart breached, then the pink channel on the daily chart breached, and finally movement below 1,265.1 to confirm a trend change. Also a clear five wave structure downward on the hourly chart would provide indication of a trend change.
Until a trend change is confirmed we must assume the trend remains up.