
Elliott Wave chart analysis for the SPX500 for 11th February, 2011. Please click on the charts below to enlarge.
As expected, Friday saw upward movement to bring price closer to our target. The target at 1,340 is also a maximum point for upward movement for the hourly wave count. We may see an end to upward movement just a little below the target.
When we have a complete wave structure on the hourly chart we will again be at a critical turning point for the S&P. At that stage the wave structure will look complete and fully mature at all wave degrees.
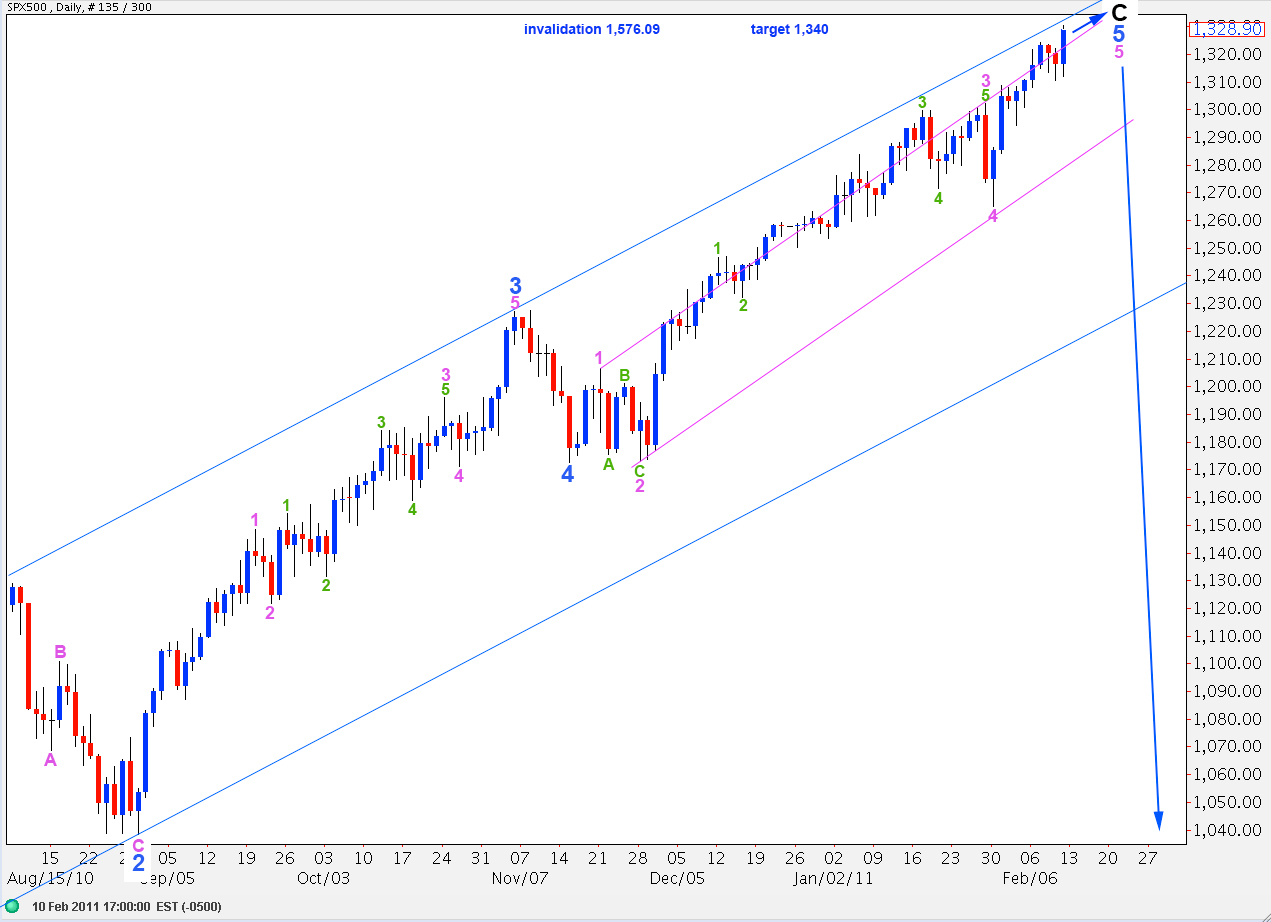
At this stage movement below 1,265.1 would be a very strong indication of a trend change. At that stage downward movement could not be a second wave correction within wave 5 pink and wave 5 pink would have to be considered over. It seems most reasonable that the labels for waves 1, 2, 3 and 4 pink would not be placed elsewhere as in these positions the look of wave 5 blue is of a perfect impulse.
Movement below the small pink parallel channel here on the daily chart will be our first indication of a trend change. The trend change will be confirmed when we see movement below the wider blue parallel channel. At that stage we may be confident that primary 2 zigzag is over and primary wave 3 would then be underway.
Last analysis expected further upward movement from the S&P and after a deep choppy correction we saw some strong upward movement.
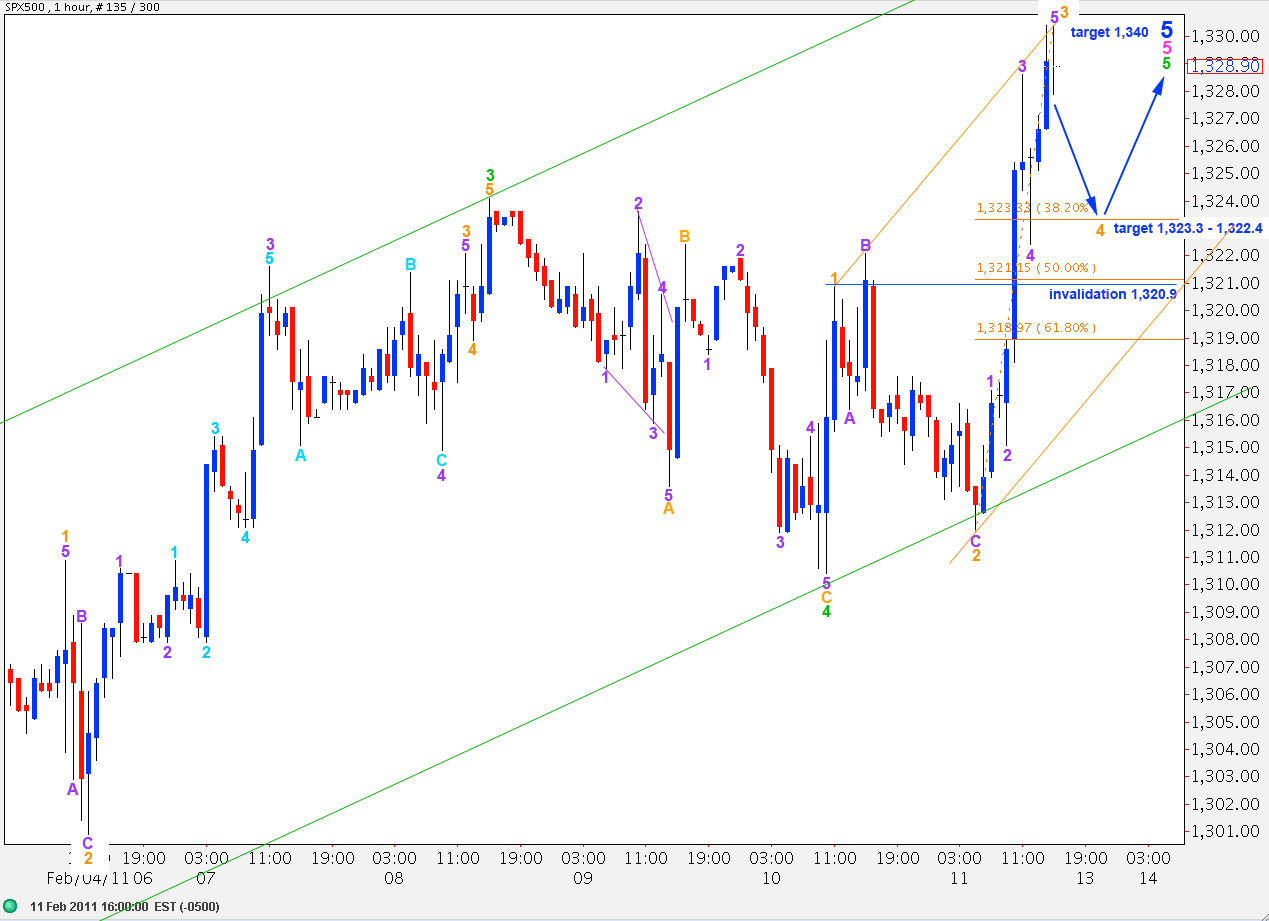
Wave 5 green is unfolding as a very typical looking impulse. Wave 2 orange was a deep 86% correction of wave 1 orange. Therefore, wave 4 orange is likely to be a shallow correction of wave 3 orange which would bring it close to the fourth wave of one lesser degree. The target zone for this small downward correction is 1,323.3 to 1,322.4. Wave 2 was an expanded flat correction,. Therefore, wave 4 is most likely to be either a zigzag or a triangle.
Wave 4 orange may not move into wave 1 orange price territory. Therefore, we should not see it move below 1,320.9.
The small orange parallel channel may provide guidance to where wave 4 orange may end. Thereafter, it may provide indication to where the final fifth wave may end, in conjunction with the larger green parallel channel drawn around wave 5 pink.
Movement below the wide green parallel channel here on the hourly chart may be our very first indication of a trend change.