
Elliott Wave chart analysis for the SPX500 for 10th February, 2011. Please click on the charts below to enlarge.
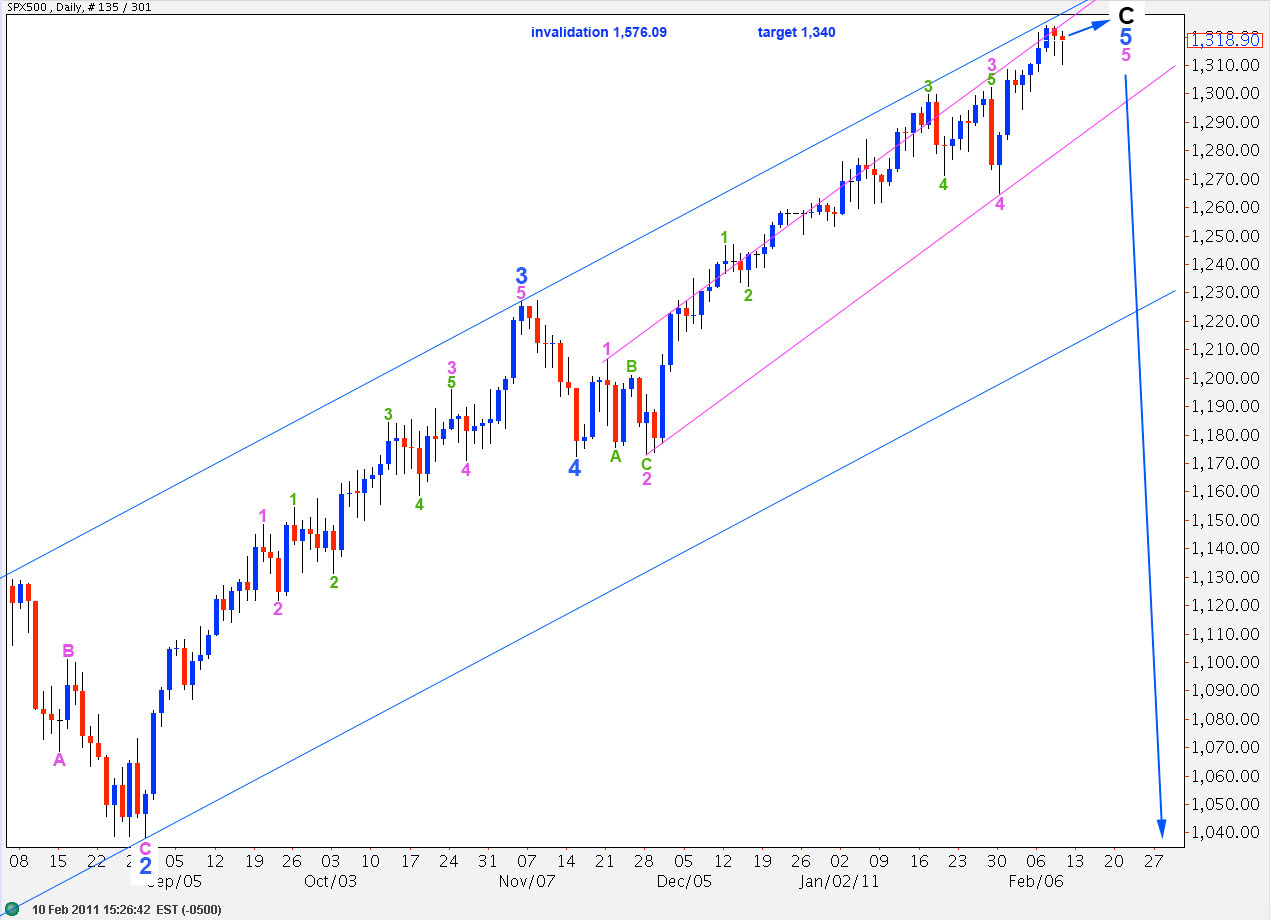
Downward movement was expected to complete a fourth wave correction. The main hourly wave count was invalidated and the alternate hourly wave count was confirmed.
We should expect one final upward five wave structure to end this upward trend at 1,340.1 or below.
When we have a final five waves up complete on the hourly chart then the S&P will again be at a critical point and we may see a large degree trend change.
Movement below the small pink parallel channel here on the daily chart will be our first indication of a trend change. The trend change will be confirmed when we see movement below the wider blue parallel channel. At that stage we may be confident that primary 2 zigzag is over and primary wave 3 would then be underway.
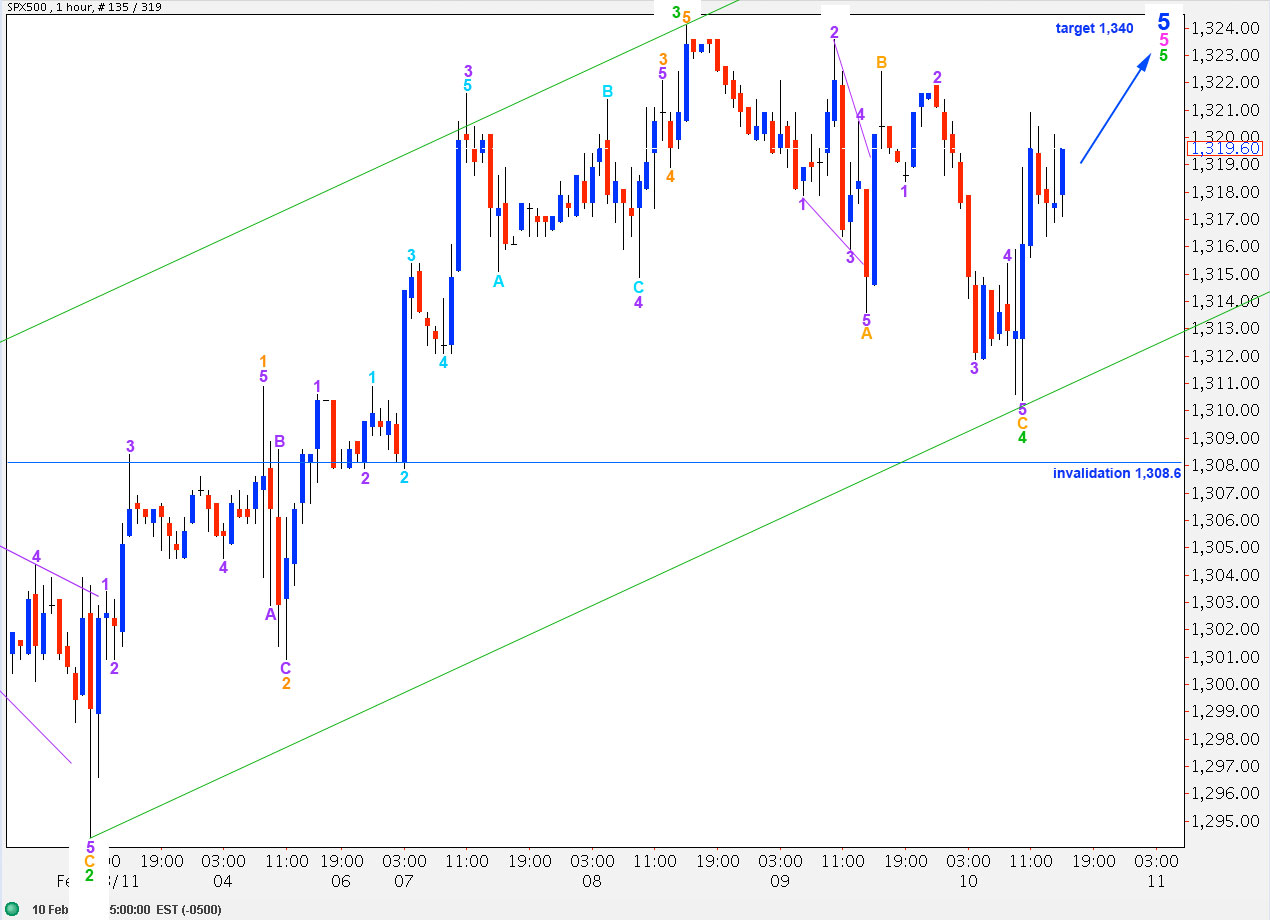
Both of yesterday’s hourly wave counts expected further downward movement to end a fourth wave correction. Movement below 1,310.9 invalidated the main hourly wave count indicating that the fourth wave could not be at orange degree.
Wave 3 green is shorter than wave 1 green and is 2.8 points short of 0.618 the length of wave 1 green. At 1,340.1 wave 5 green will reach equality with wave 1 green. This is the maximum limit for upward movement for this wave count.
The green parallel channel drawn here showed where wave 4 green ended very nicely. We may now use it to indicate an end to wave 5 green and, most importantly, when it is breached to the downside with significant movement we shall have our first indication of a trend change.
This structure on the hourly and daily charts is now looking very close to completion.
Any further extension downward of wave 4 green may not move beyond the end of wave 1 green. This wave count is therefore invalidated with movement below 1,308.6.