
Elliott Wave chart analysis for the SPX500 for 4th February, 2011. Please click on the charts below to enlarge.
The S&P has moved slightly higher as expected but upward movement is slow and small.
We may expect that a little more upward movement is most likely, probably for a few more days trading yet.
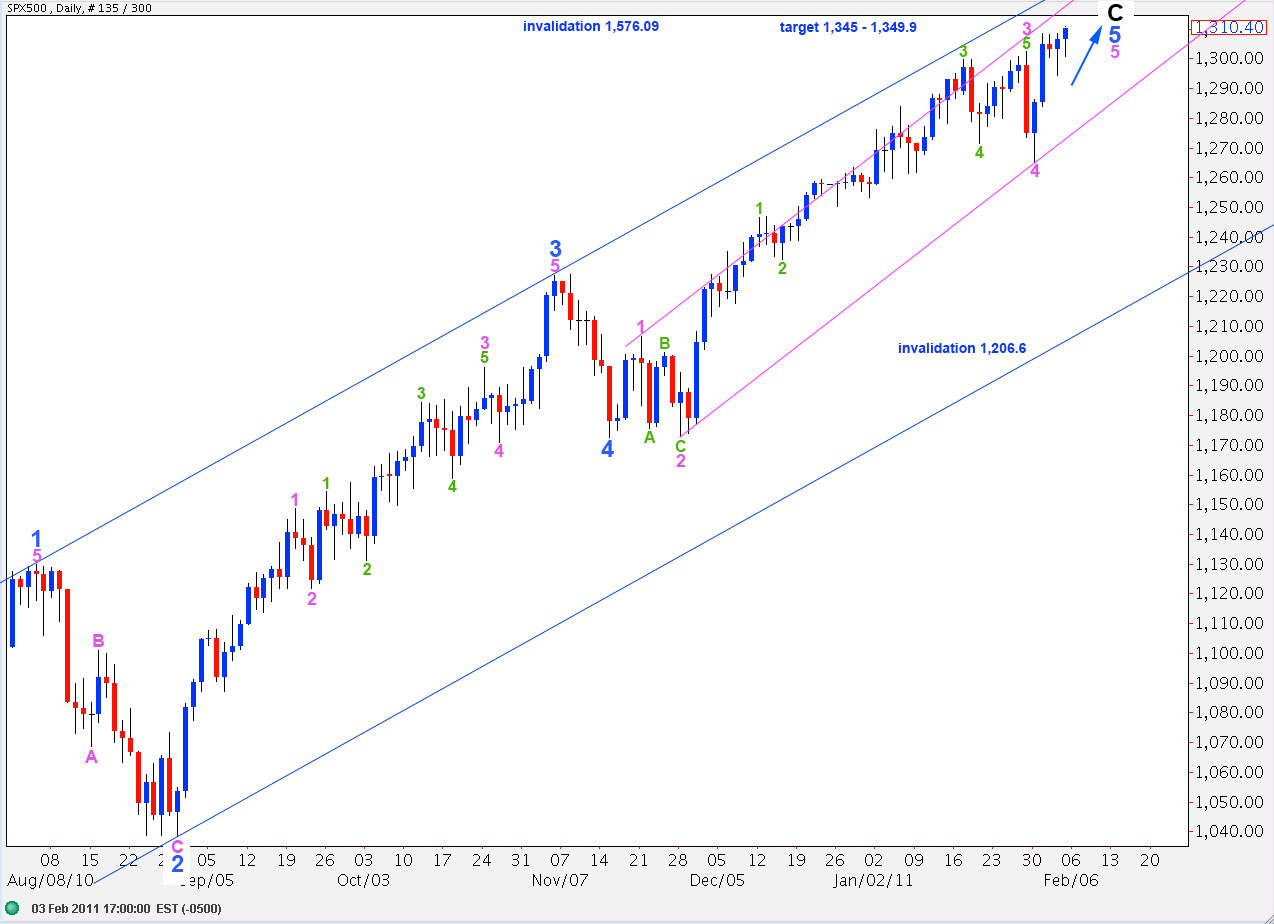
At 1,345 wave 5 pink to end wave 5 blue will reach 0.618 the length of wave 3 pink. At 1,349.9 wave C black will reach 0.618 the length of wave A black. Therefore, our target zone for upward movement to end is 1,345 to 1,349.9.
For this main wave count price may not move above 1,576.09. However, the alternate historical wave count allows for new highs for the S&P. This alternate possibility requires movement above 1,485.16 to be valid.
The pink parallel channel drawn here around wave 5 blue is Elliott’s technique. We may expect wave 5 pink to end either midway in the channel, or at the upper end of it. When we see significant movement below and outside the channel we shall have a strong indication that the S&P has had a trend change.
It is possible again to see a complete wave structure at all degrees. Therefore, we begin the new trading week with two hourly wave counts.
Main Hourly Wave Count.
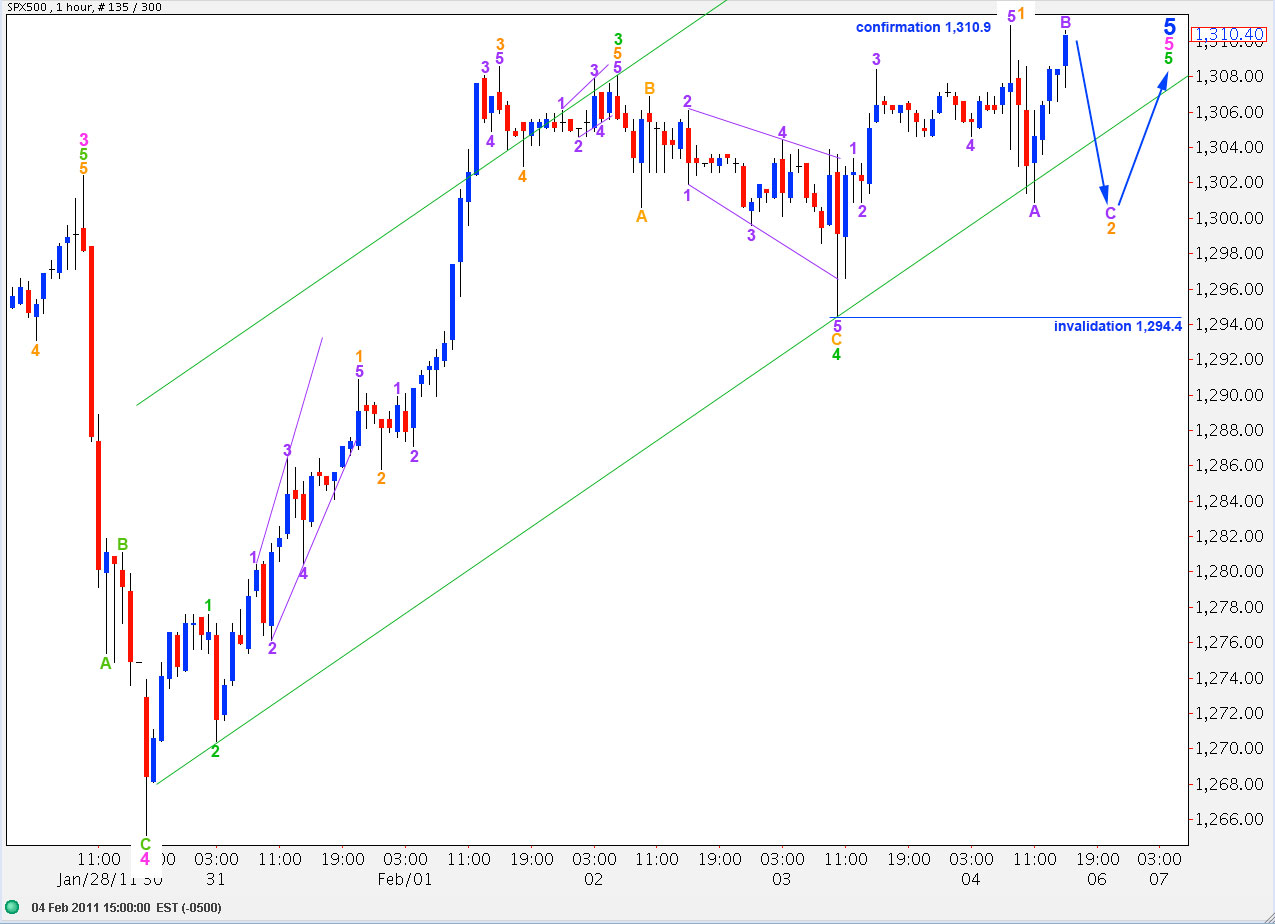
Upward movement during Friday’s session may have been a complete wave 1 orange within wave 5 green. There are no relationships of equality or fibonacci ratios within wave 1 orange.
Movement above 1,310.9 would confirm this wave count. At that stage we may expect price to continue to rise toward the target zone.
Movement below 1,294.4 would invalidate this hourly wave count as wave 2 orange may not move beyond the start of wave 1 orange.
The green parallel channel drawn here around wave 5 pink is a best fit. We may expect wave 5 green to end either midway in the channel (very common) or toward the upper end of the channel (less common).
If this wave count is invalidated with movement below 1,294.4 then we should use the alternate wave count below. However, this is not confirmation of a trend change.
Alternate Hourly Wave Count.
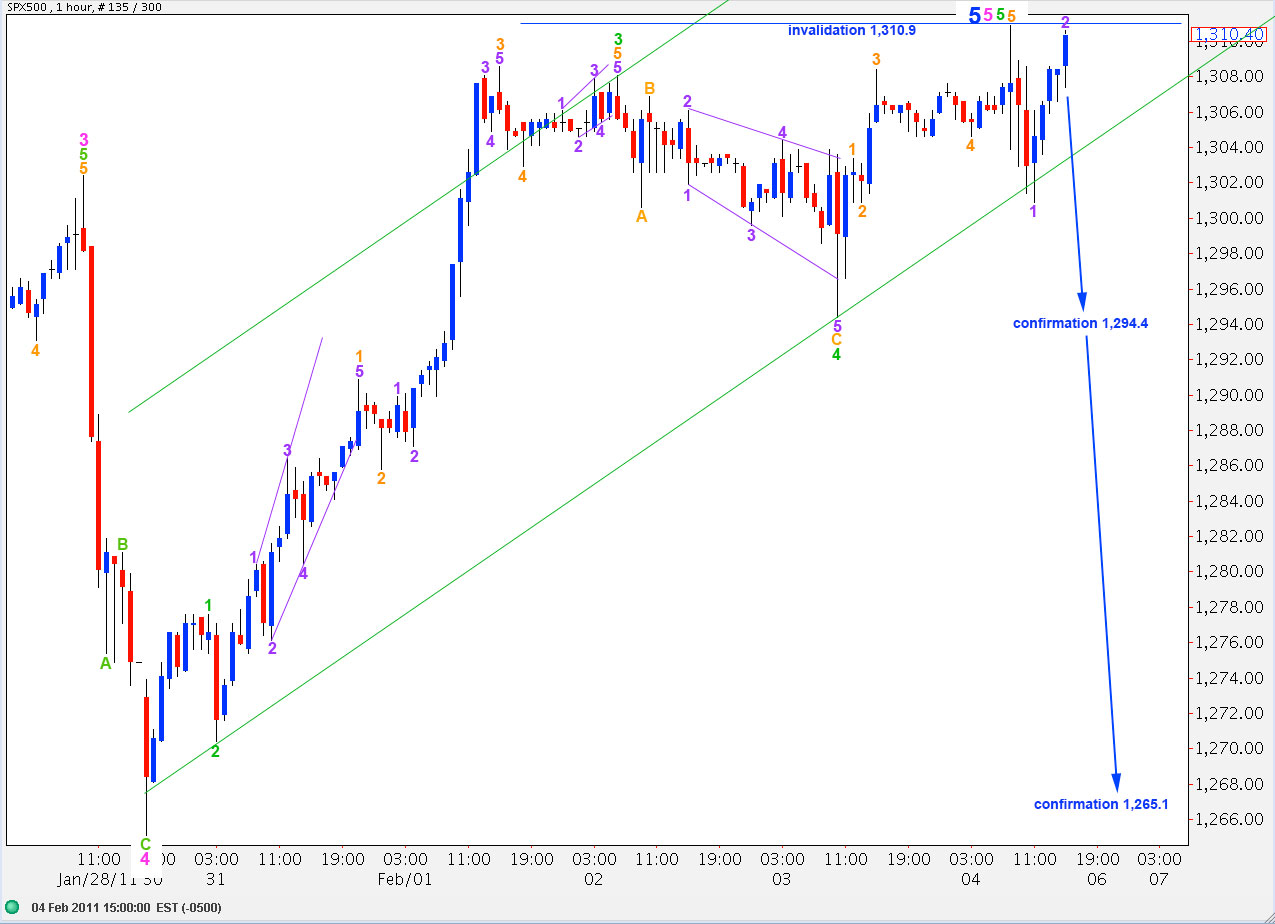
Because we can see a complete structure at all wave degrees we must consider the possibility again of a trend change. In the short term this possibility will be eliminated if price moves above 1,310.9.
Movement below 1,294.4 would be a first indication of a trend change, but it may only be at green degree.
Movement below 1,265.1 would be strong indication of a trend change as at that stage downward movement may not be a second wave correction within wave 5 pink. Therefore, wave 5 pink (if it began at 1,265.1) would have to be over.
If a high is in place then ratios are:
At black degree there is no ratio between waves C and A.
At blue degree wave 3 blue is just 8.6 points short of 1.618 the length of wave 1 blue and there is no fibonacci ratio between wave 5 blue and either 1 or 3.
At pink degree within wave 5 blue: wave 3 pink is 15 points short of 4.236 the length of wave 1 pink and wave 5 pink is 3.6 points short of 0.382 the length of wave 3 pink.
At green degree within wave 5 pink: there are no relationships of equality nor fibonacci ratios between any of green waves 1, 3 or 5. This gives some doubt to this wave count. We would expect it to be likely to find a relationship between two of these three actionary waves.
Movement below and outside of the pink parallel channel on the daily chart would be further confirmation of a trend change.