
Elliott Wave chart analysis for the SPX500 for 3rd February, 2011. Please click on the charts below to enlarge.
The S&P has moved mostly sideways for the last two sessions so the situation is still mostly unchanged.
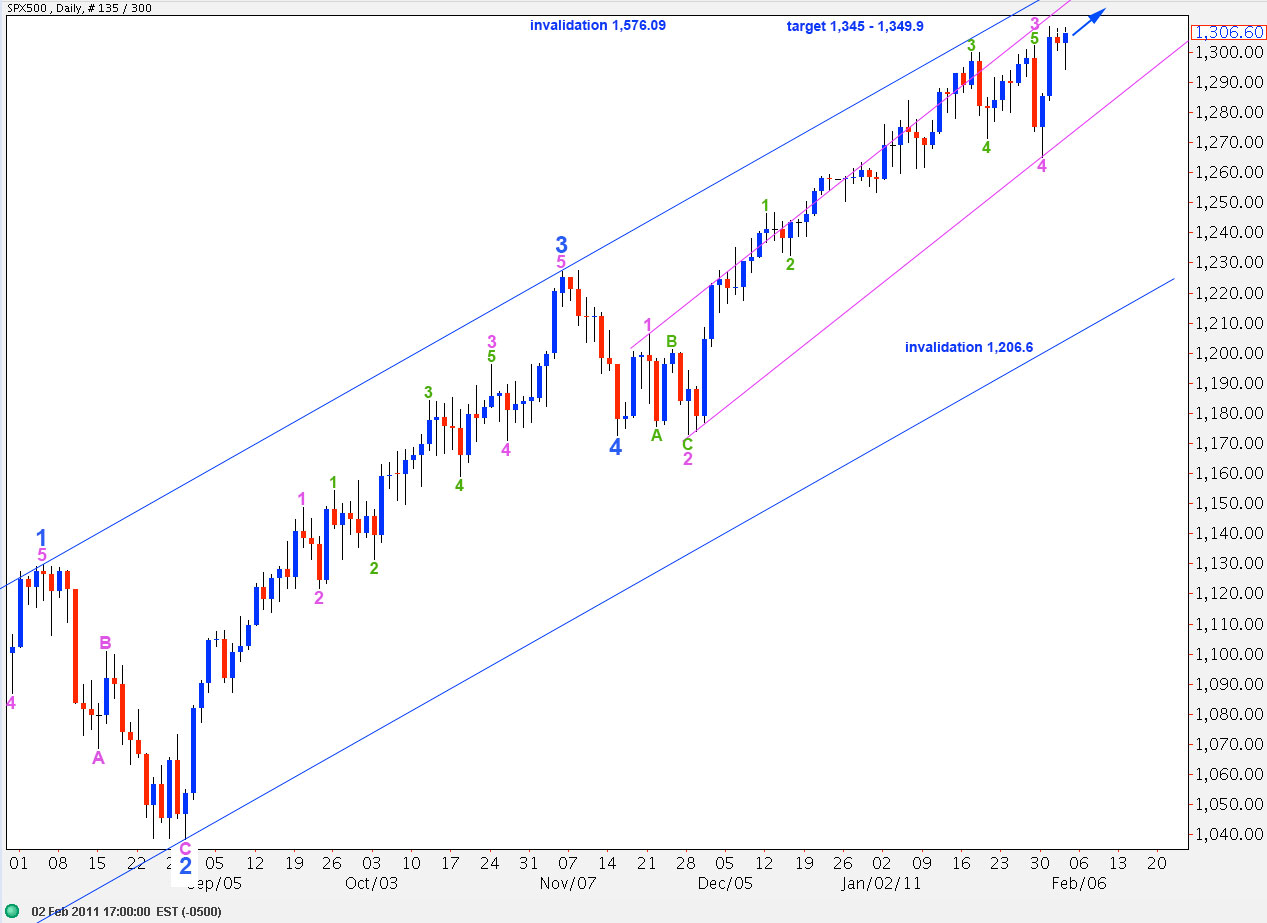
This sideways move is most likely two fourth wave corrections in a row. We still need further upward movement to complete a satisfactory five wave structure.
Waves 4 and 2 pink are proportional to each other in length, giving this wave 5 blue a nice impulsive five wave structure. Wave 3 pink is just 15 points short of 4.236 the length of wave 1 pink. At 1,345 wave 5 pink will reach 0.618 the length of wave 3 pink.
At 1,349.9 wave C black will reach 0.618 the length of wave A black.
Ratios within pink wave 3 are: wave 3 green is 6.3 points short of equality with wave 1 green and wave 5 green is just 2.8 points longer than 0.382 the length of green wave 1.
Upward movement may not move above 1,576.09 as primary wave 2 may not move beyond the start of primary wave 1. However, the alternate historical wave count for the S&P sees new highs as possible and likely.
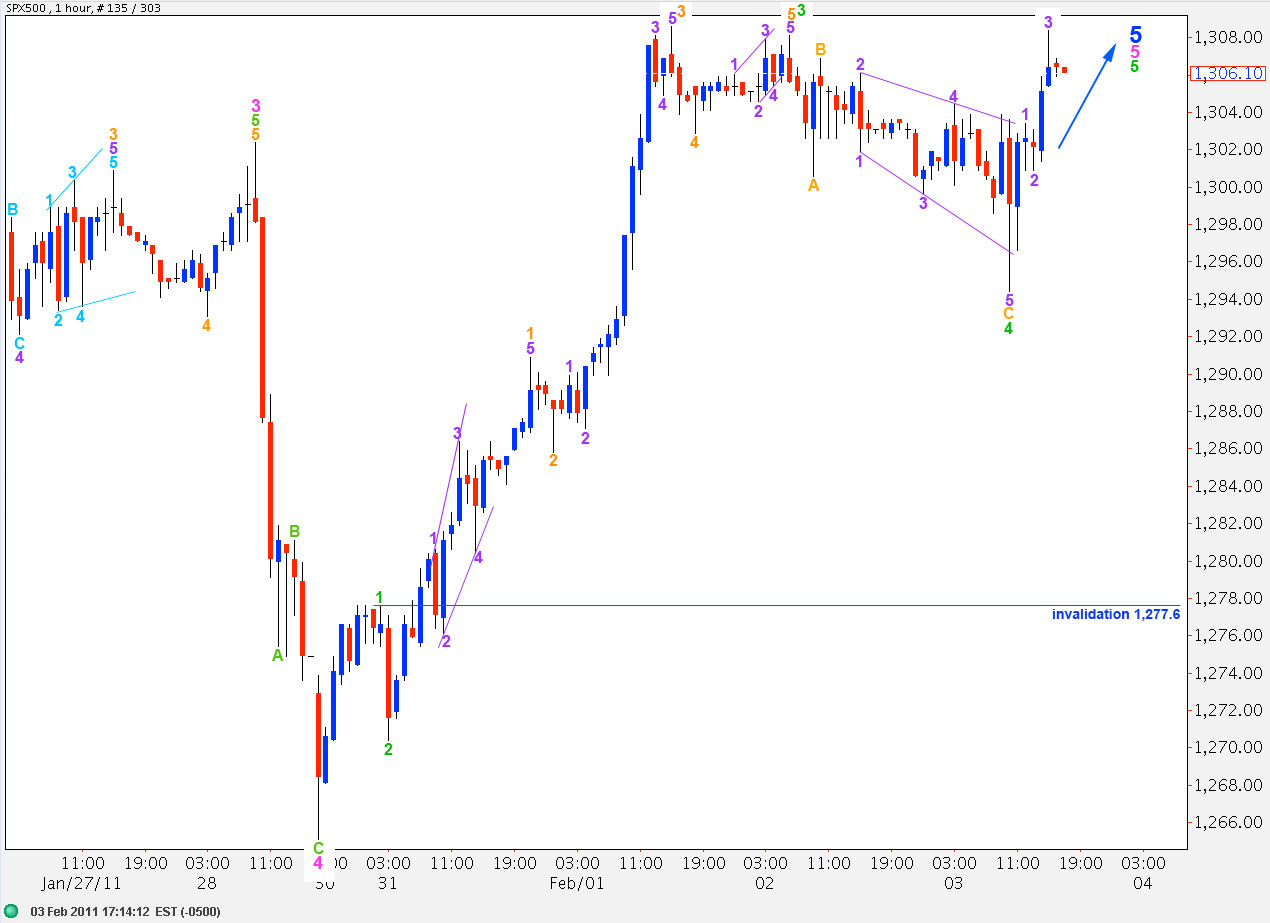
I have adjusted this wave count slightly from yesterday.
Ratios within wave 3 green are: wave 3 orange is 2.3 points longer than equality with wave 1 orange and wave 5 orange ending diagonal was just 0.2 points short of 0.236 the length of wave 3 orange.
Wave 4 green is a zigzag with wave B an 84% correction of wave A and wave C orange just 0.4 points longer than 1.618 the length of wave A orange.
If wave 3 green reached equality with wave 3 green this would end about 1,332.1, which is just a little below the target calculated on the daily chart.
Any further downward extension of wave 4 green may not move into wave 1 green price territory. Therefore, this wave count is invalidated with movement below 1,277.6.