
Elliott Wave chart analysis for the SPX500 for 31st January, 2011. Please click on the charts below to enlarge.

Upward movement since last analysis, although not invalidating the hourly wave count, came sooner than expected.
We still do not have a trend change confirmed. Movement below 1,253.4 would mean that downward movement may not be a second wave correction within wave 5 pink and, therefore, wave 5 pink must be over.
We have a clear breach still of the small parallel channel containing most recent upward movement. However, the correction of the last couple of days may only be at minute degree. We do not have confirmation of a high in place.

Last analysis expected further downward movement. This was not the case and now the downward wave labeled 1 purple looks suspiciously like a three. For this reason I do not have confidence that we have seen a trend change.
When this downward movement is viewed carefully on a 5 minute chart it is possible to see it as an impulse.
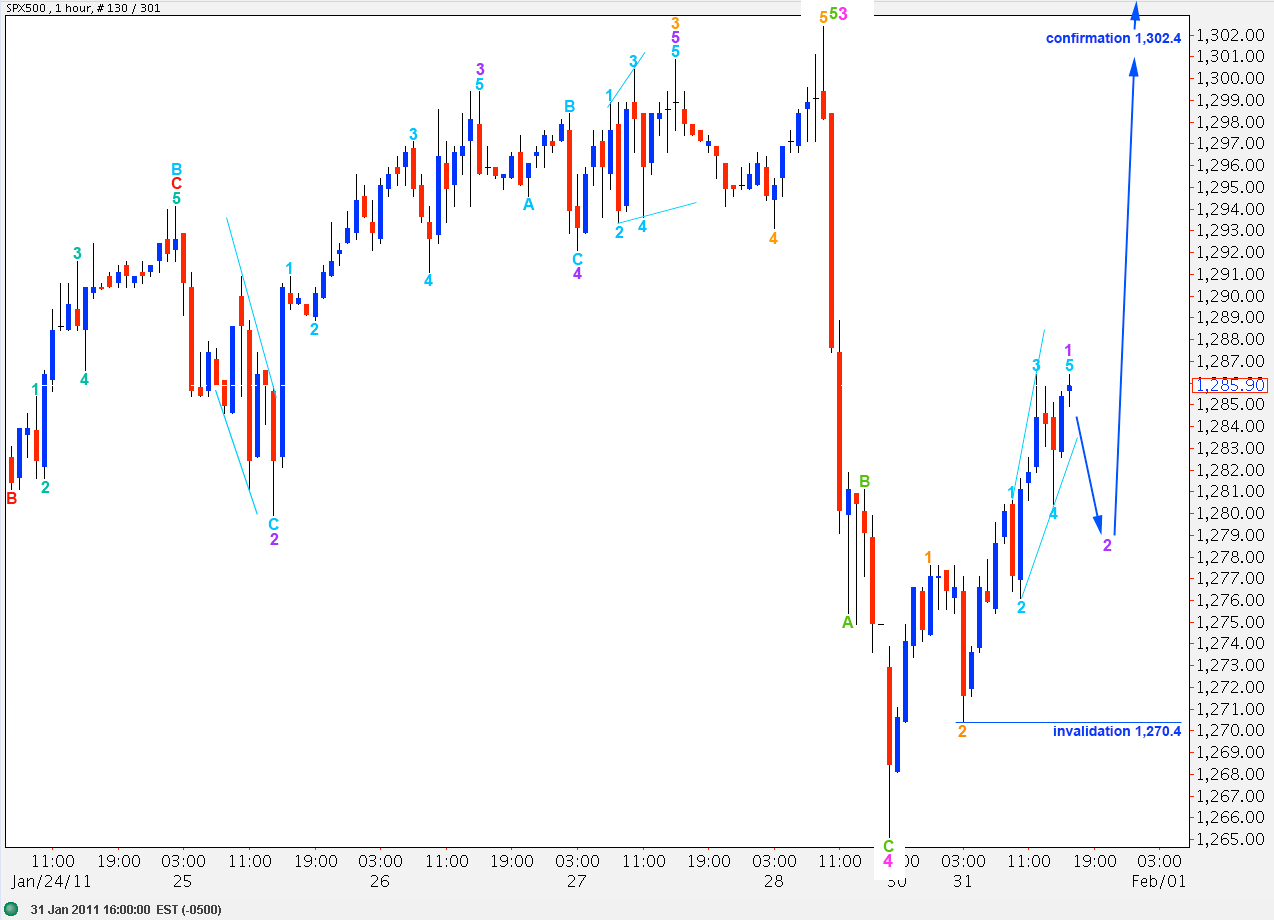
If we have seen a trend change we need to see movement below 1,270.4 in the first instance to invalidate the alternate hourly wave count; then below 1,265.1 because wave 3 purple must move beyond the end of wave 1 purple. Even then, downward movement could be A-B-C as it has the same look and subdivisons of 1-2-3. We need to see a complete five wave down sequence on the hourly chart to have more confidence of a trend change.
Alternate Wave Count.

This wave count remains viable.
This wave count allows for further upward movement to enable waves C and A at intermediate degree to achieve a fibonacci relationship.
Wave 4 pink may not move into wave 1 pink price territory. Therefore, this wave count would be invalidated by movement below 1,206.6.
At 1,349.9 wave 5 blue will reach equality with wave 3 blue. At 1,361.6 wave C black will reach 0.618 the length of wave A black. At 1,343.5 wave 5 pink would reach 0.618 the length of wave 1 pink.
Because downward movement now looks so much like a three, we should seriously consider the implications of this wave count. Until we can see a clear five down on the hourly chart, we should be alert for a trend change but know that it is unconfirmed.
Upward movement must be continuing as either an impulse or a diagonal to the upside. Wave 2 purple may not move beyond the start of wave 1 purple. Therefore, this wave count would be invalidated with movement below 1,270.4.
If price remains above 1,265.1 in the short to mid term then this downward movement has a strong three wave look and structure.
This downward wave may have been a wave at minute degree.
If this wave count is correct we should see steady upward movement from the S&P to new highs (although not required it would be highly likely).