
Elliott Wave chart analysis for the SPX500 for 28th January, 2011. Please click on the charts below to enlarge.
Friday’s session saw one final small wave to the upside, followed by some violent downward movement. It is increasingly likely that we may have seen a trend change on Friday.
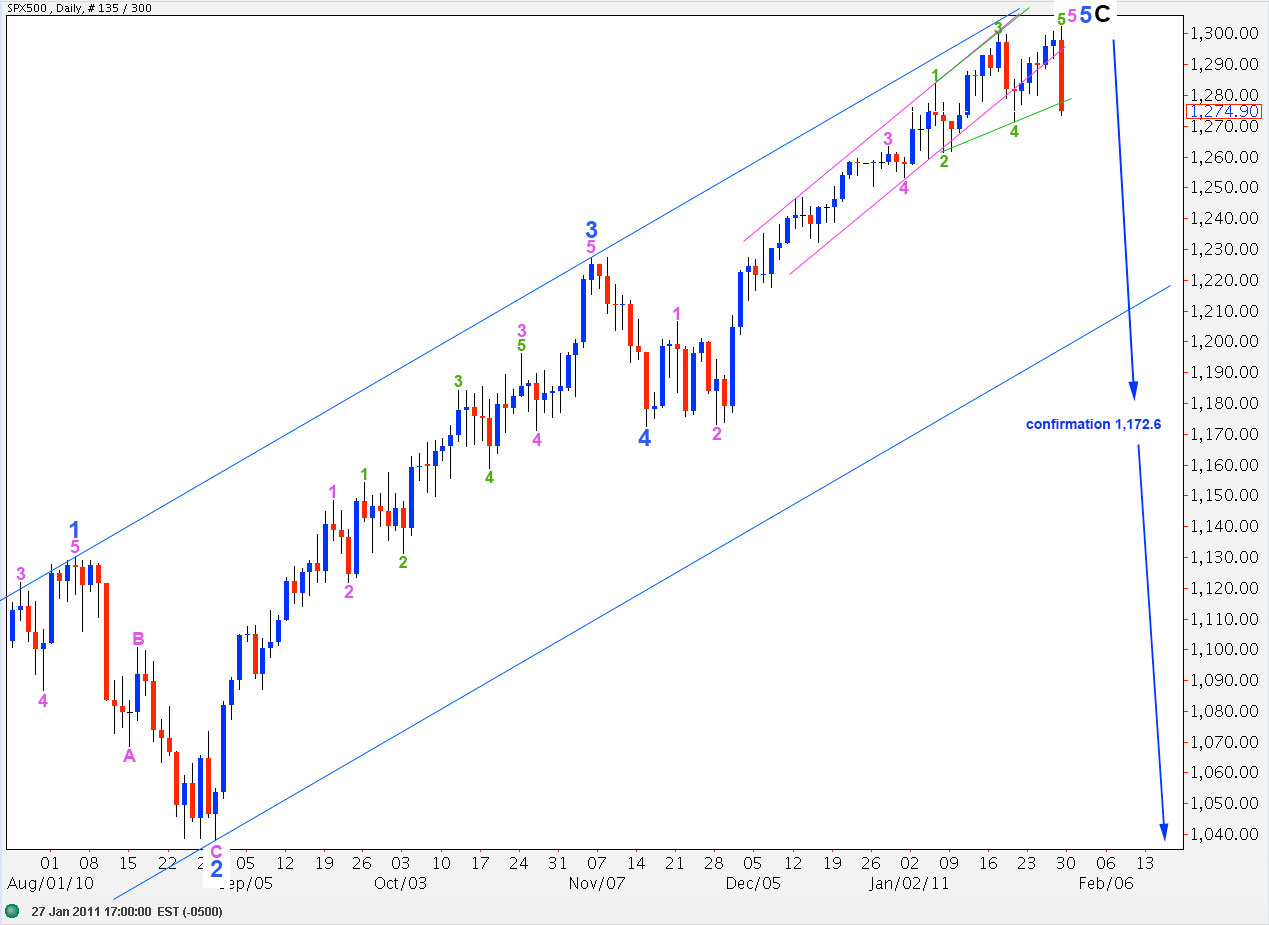
If upward movement is over then this degree of labeling has a better overall look and ratios are very good.
There is no ratio at intermediate (black) degree.
Within wave C black ratios are: wave 3 blue is 8.6 points short of 1.618 the length of wave 1 blue and wave 5 blue is 7.9 points longer than equality with wave 1 blue. This is an almost textbook perfect impulse.
Ratios within wave 5 blue are: wave 3 pink is just 1.3 points longer than 2.618 the length of wave 1 pink and wave 5 pink is 6.8 points short of 0.618 the length of wave 3 pink.
Wave 5 pink is an ending expanding diagonal. Both waves 2 and 4 are 74% corrections of their predecessors. Wave 3 green is the longest but wave 4 is longer than wave 2 and wave 5 is longer than wave 1 (albeit by only half a point).
We have a clear breach of the small pink trend channel containing the end of wave 5 blue. This may be our first indicator of a trend change.
Movement below 1,271.4 may be considered confirmation of a trend change, at least at minute degree.
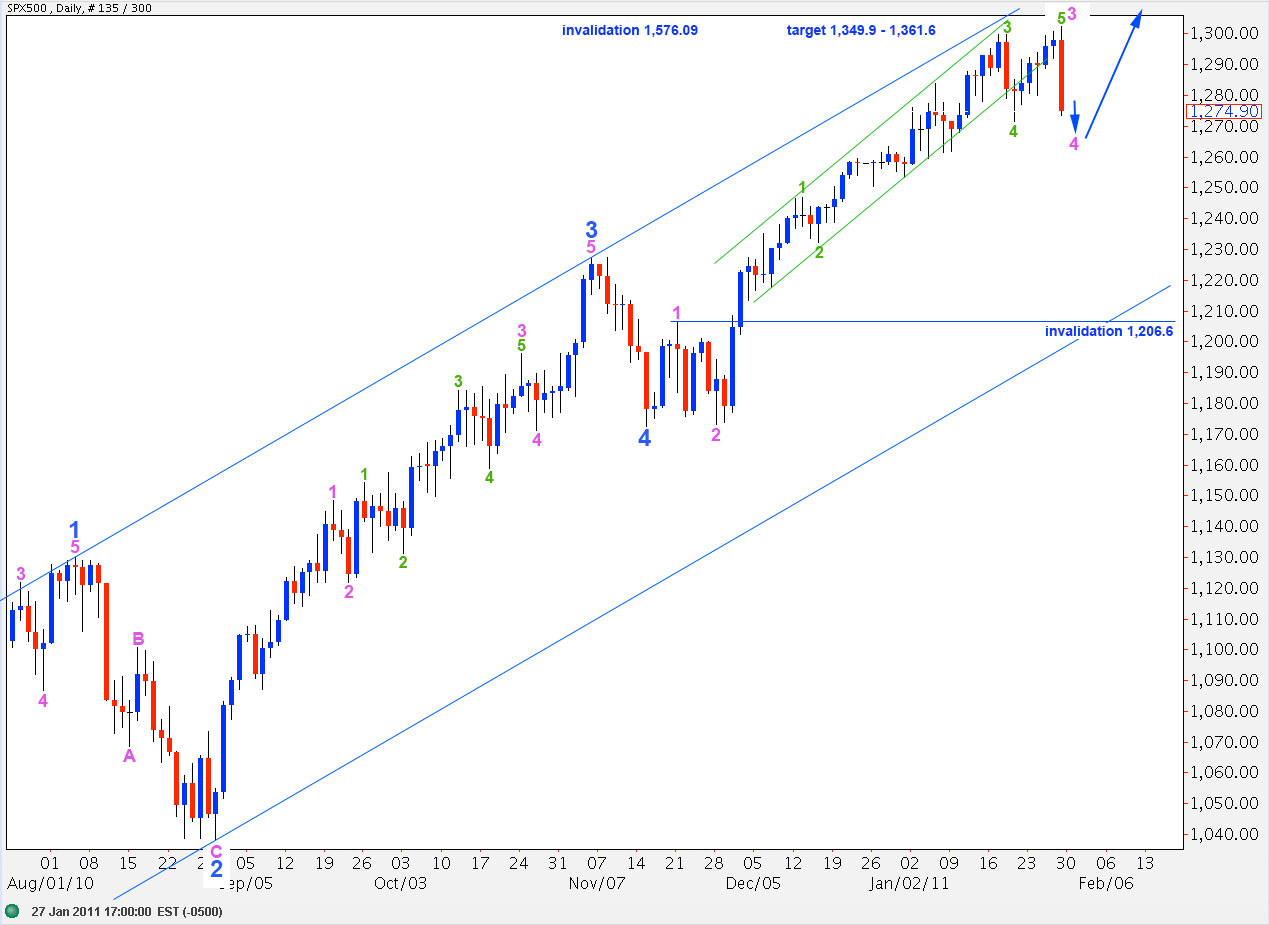
I have adjusted this wave count for this degree of labeling. We may expect waves of the same degree to be reasonably in proportion to each other. Therefore, the downward wave which began on Friday may be wave 4 pink.
There is no fibonacci ratio between waves 1 and 3 pink.
Wave 4 pink may not move into wave 1 pink price territory. Therefore, this wave count would be invalidated by movement below 1,206.6.
At 1,349.9 wave 5 blue will reach equality with wave 3 blue. At 1,361.6 wave C black will reach 0.618 the length of wave A black.
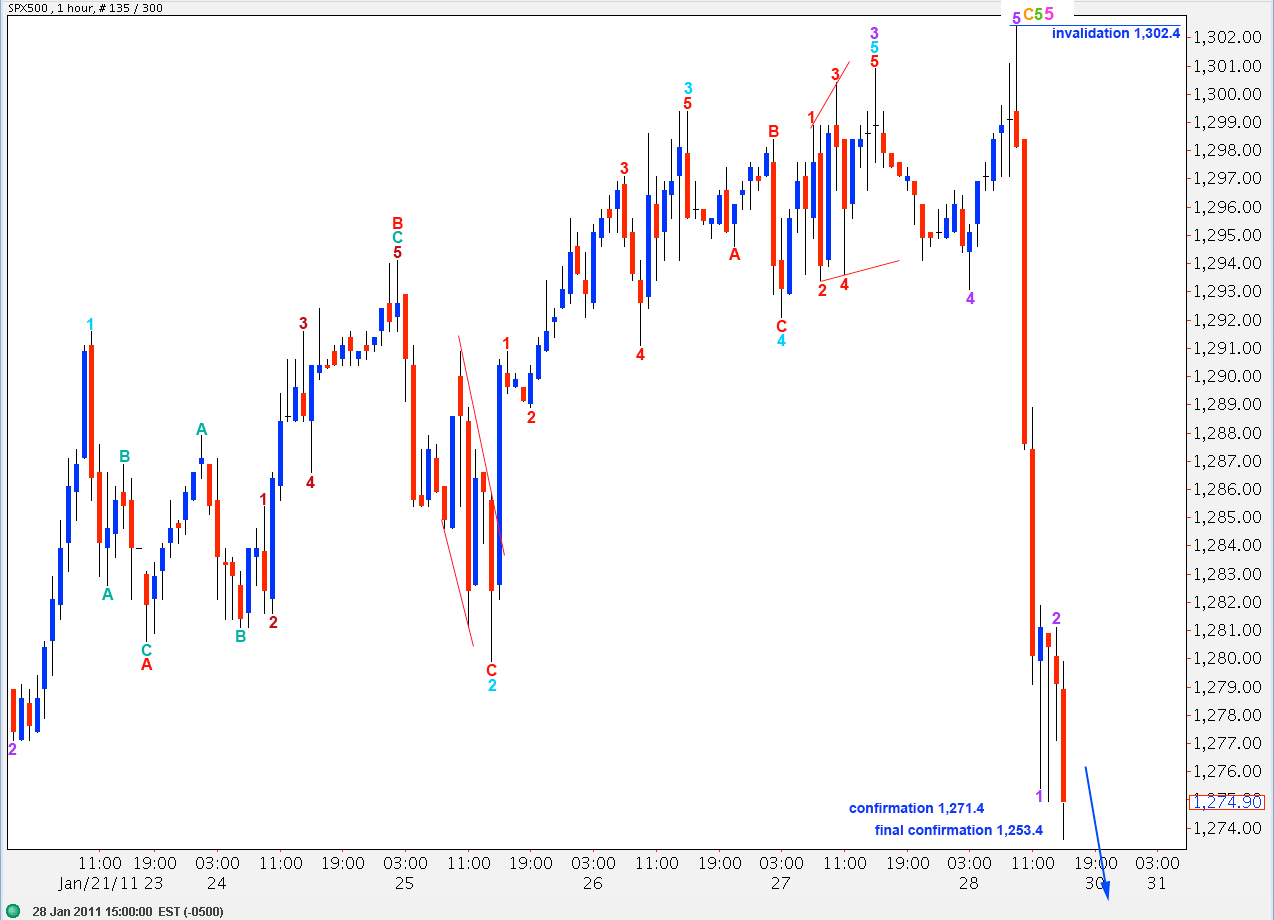
Thursday’s analysis expected an end to the small fourth wave correction labeled here 4 purple, to be followed by a final fifth wave to the upside labeled here 5 purple. At that stage the structure for wave 5 blue was complete at all wave degrees and a trend change was possible.
Wave behaviour is supporting this wave count nicely. We should expect that when we do see the trend change that downward movement may be very swift and violent.
Movement below 1,271.4 would be confirmation of a trend change, at least at minute degree. When price moves below 1,253.4 then downward movement may not be a second wave correction within wave 5 pink and wave 5 pink must be over. Therefore, this price point should provide final confirmation of a trend change.
I have moved the labeling of upward movement up one degree from Thursday’s analysis to fit with the first daily chart.
Wave 5 green as the last zigzag of an ending diagonal subdivides into A-B-C at orange degree.
Ratios within wave C orange are: wave 3 purple is 3.6 points short of 1.618 the length of wave 1 purple and wave 5 purple is just 0.2 longer than 0.382 the length of wave 3 purple.