
Elliott Wave chart analysis for the SPX500 for 26th January, 2011. Please click on the charts below to enlarge.
Upward movement has failed to make a new high. We still do not have confirmation of a trend change. The possibility of further highs while price remains above 1,271.4 will remain.
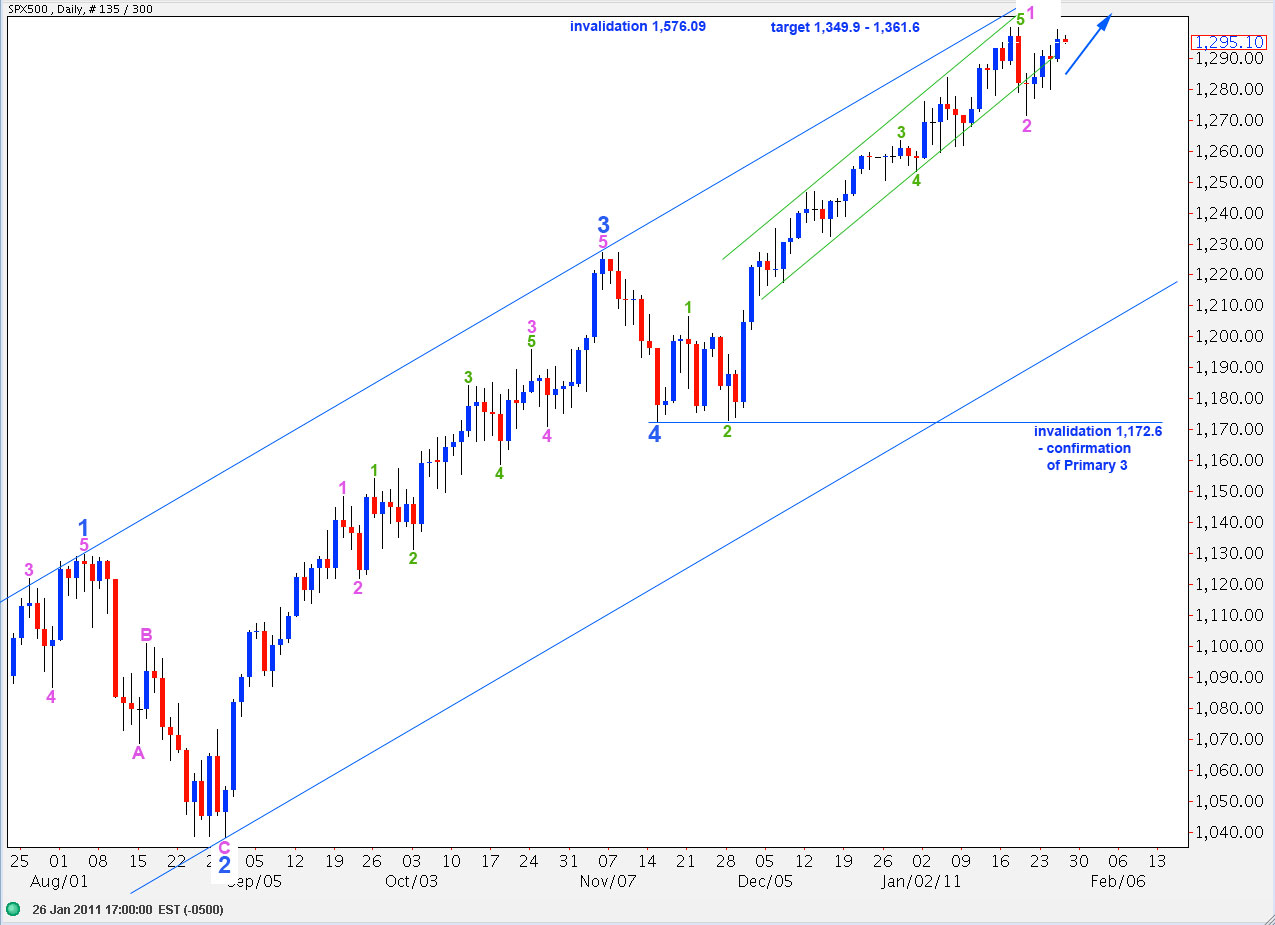
If this degree of labeling is correct then recent downward movement was likely a second wave at minute degree. This wave count expects further upward movement. At 1,349.9 wave C black will reach 0.618 the length of wave A black. At 1,361.6 wave 5 blue will reach equality with wave 3 blue.
Wave 2 at primary degree may not move beyond the start of primary wave 1. Therefore, this wave count is invalidated with movement above 1,576.09.
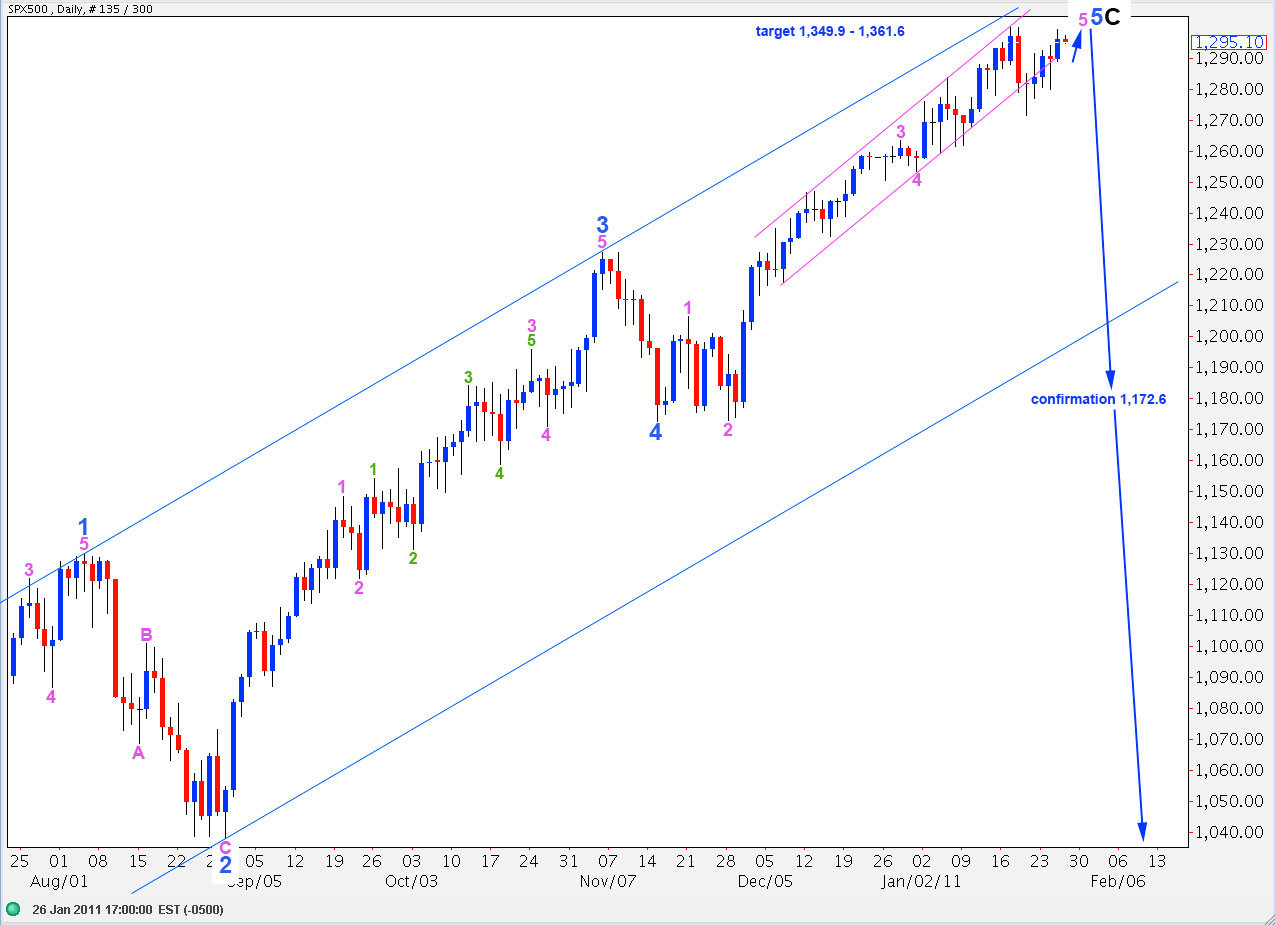
If this degree of labeling is correct we may have a high in place.
Wave C black has no fibonacci ratio to wave A black.
Ratios within wave C black are: wave 3 blue is 8.6 points short of 1.618 the length of wave 1 blue and wave 5 blue is 5.4 points longer than equality with wave 1 blue.
Ratios within wave 5 blue are: wave 3 pink is 1.29 points longer than 2.618 the length of wave 1 pink and wave 5 pink is 9.3 points longer than 0.618 the length of wave 3 pink.
This degree of labeling will be confirmed when price moves below 1,172.6.
Main Hourly Wave Count.
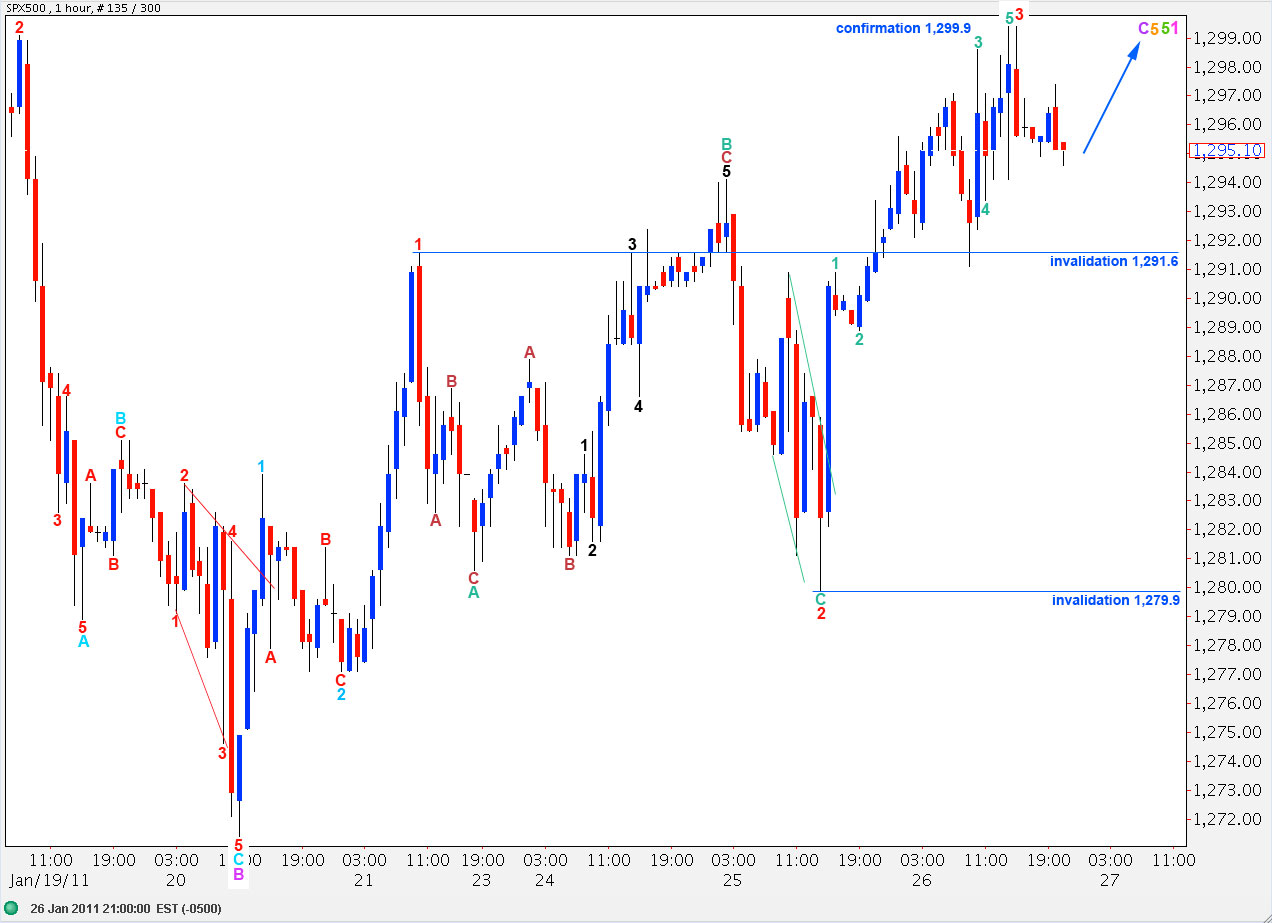
This wave count remains technically valid but it still does not have the right look. Wave 2 red is out of proportion to wave 2 aqua, one degree higher than it.
We need to see movement above 1,299.9 to confirm this wave count. At that stage we should expect a reasonable amount of further upward movement to satisfy a five wave structure for wave C purple.
Ratios within wave 3 red are: wave 3 teal is 1.3 points short of equality with wave 1 teal and wave 5 teal is 0.8 points short of 0.618 the length of wave 1 teal.
Wave 4 red may not move into wave 1 red price territory. Therefore, this wave count is initially invalidated with movement below 1,291.6. At that stage we may be seeing further extension of wave 3 red.
Any second wave correction within wave 3 red may not move beyond the start of it. Therefore, this wave count is further invalidated with movement below 1,279.9.
At that stage we would be fairly confident of a trend change.
Alternate Hourly Wave Count.
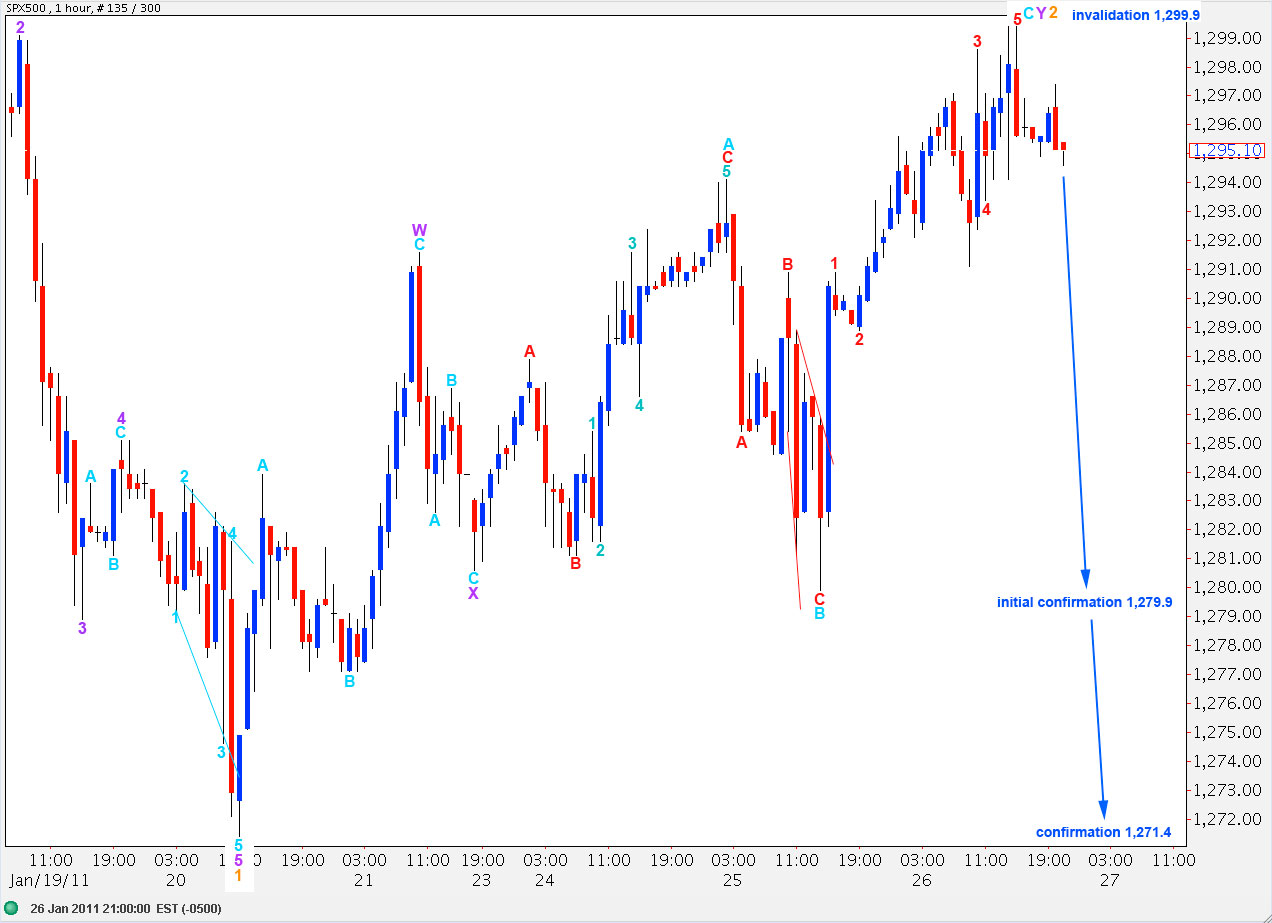
Upward movement may have been an extension of wave 2 orange as a double combination correction. What was yesterday labeled wave Y purple may have only been wave A of wave Y purple expanded flat correction.
This expanded flat has very good ratios: wave B aqua is a 105% correction of wave A aqua and wave C aqua is 2.3 points short of 1.618 the length of wave A aqua.
This wave count will have initial confirmation with price movement below 1,279.9.
Final confirmation of a trend change may come with price movement below 1,271.4 and outside of the smaller parallel channel around recent movement on the daily chart.