
Elliott Wave chart analysis for the SPX500 for 25th January, 2011. Please click on the charts below to enlarge.
Sideways movement in an increasing range has invalidated the hourly wave count necessitating a thorough reanalysis of most recent movement. I have two hourly wave counts for you today. While price remains in a range of 1,294.1 above and 1,277.1 below both wave counts will remain valid.
At this stage movement below 1,271.4 may be considered confirmation of a trend change. I can see one possibility that allows for movement below 1,271.4 to be still a smaller correction, to be followed by more upwards movement and new highs. However, this possibility has a horrible look.
Movement below 1,253.4 may be considered final confirmation of a trend change. At that stage it would also be most likely that with the depth of downward movement the trend change would be at primary degree.
On Friday 28th January wave 5 blue will have lasted a fibonacci 55 days. It may end on this date, plus or minus two days either side.
We have some indication a trend change is coming up: the bearish candlestick pattern remains intact. We have a perfect double top. We have some movement outside the small trend channel containing recent upward movement.
We need to see a full candlestick below the parallel channel containing recent movement, and we need to see movement below 1,271.4 now to confirm a trend change.
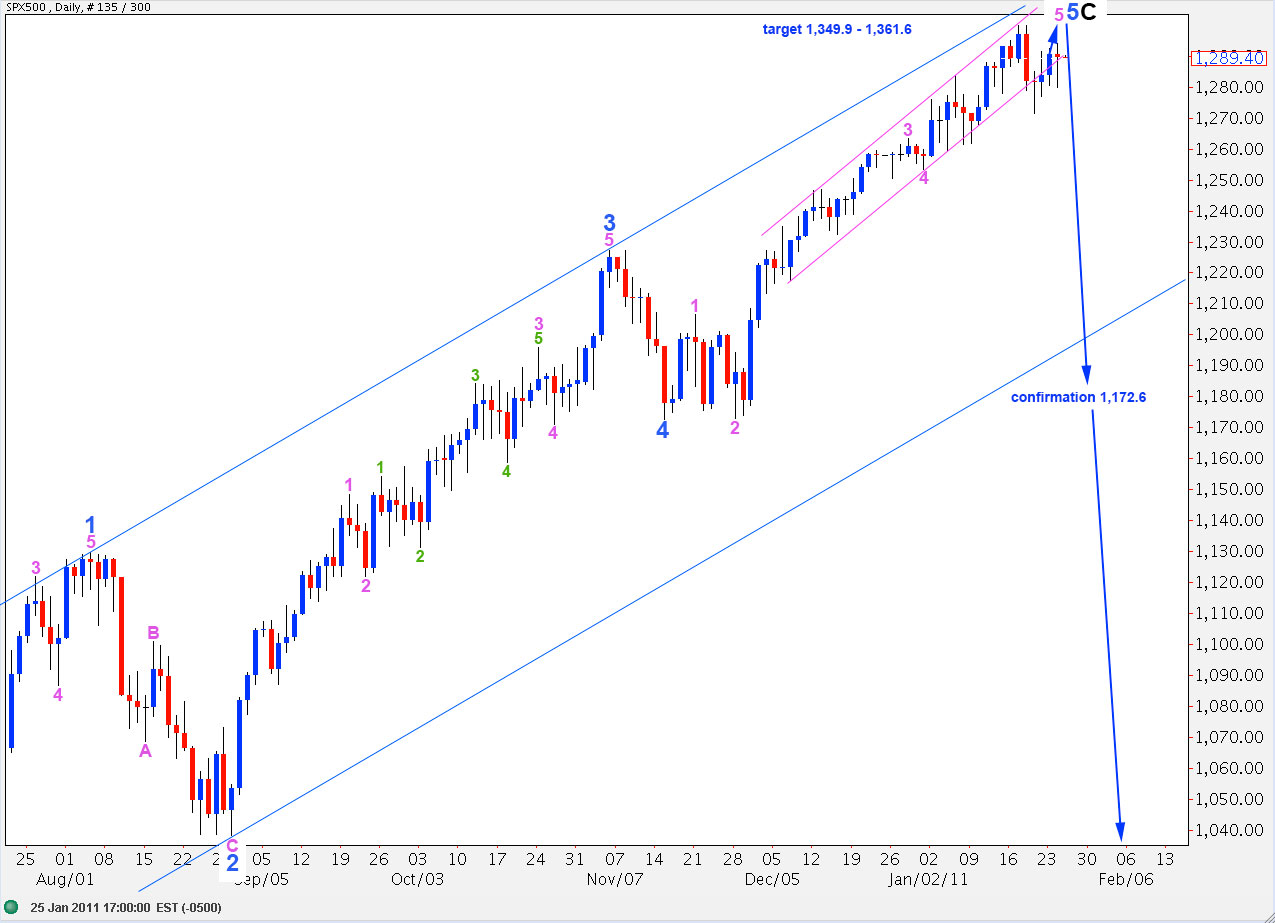
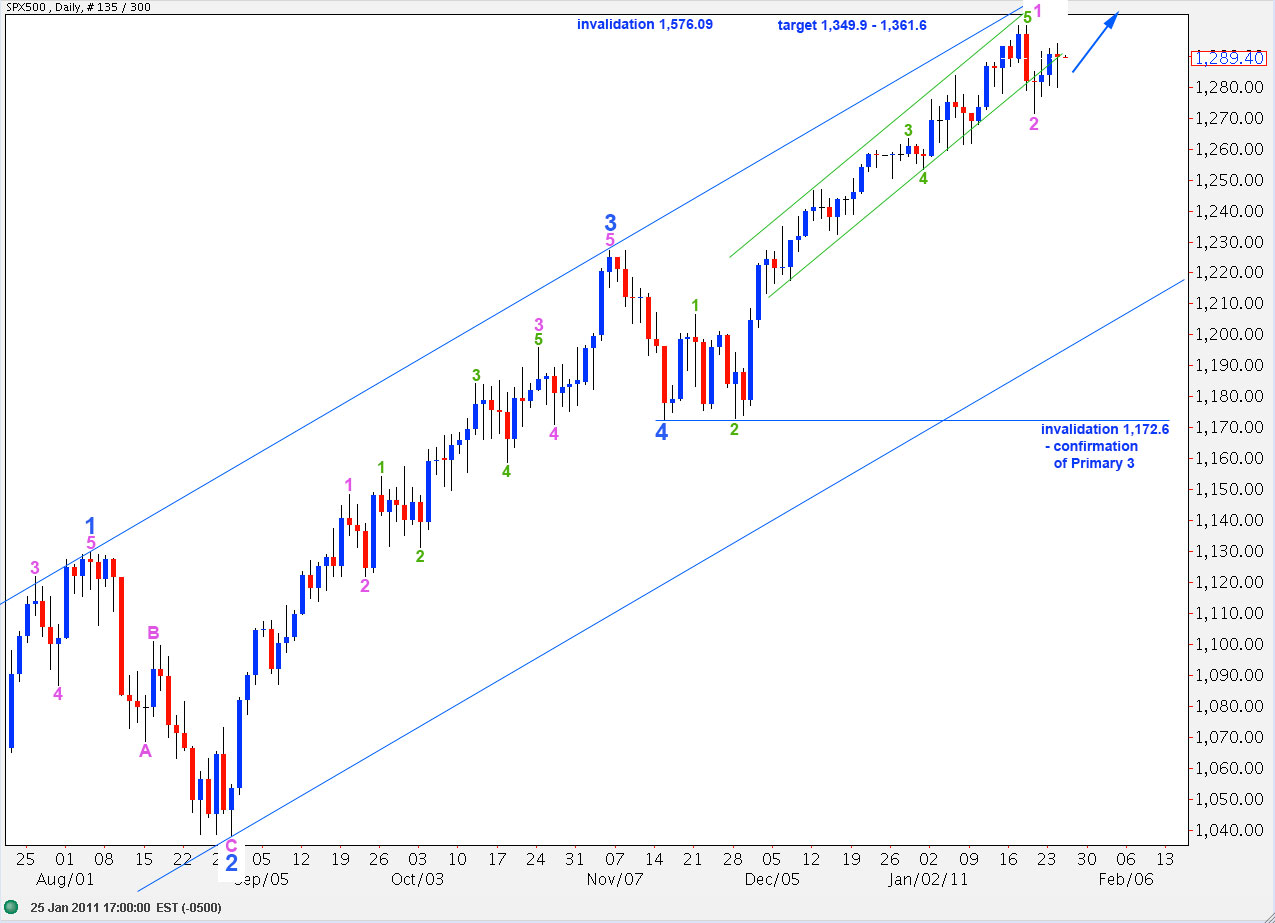
By moving the labeling of movement since the end of wave 4 blue up one degree, we may be nearing the end of minor wave 5 and intermediate wave C and, therefore, primary wave 2.
Movement below 1,172.6 will confirm this degree of labeling and confirm an end to primary wave 2. At that point we may expect the S&P to continue with strong downward movement to new lows.
If this degree of labeling, and the monthly main wave count, are correct then downward movement to come should be strong and volatile.
Main Hourly Wave Count.
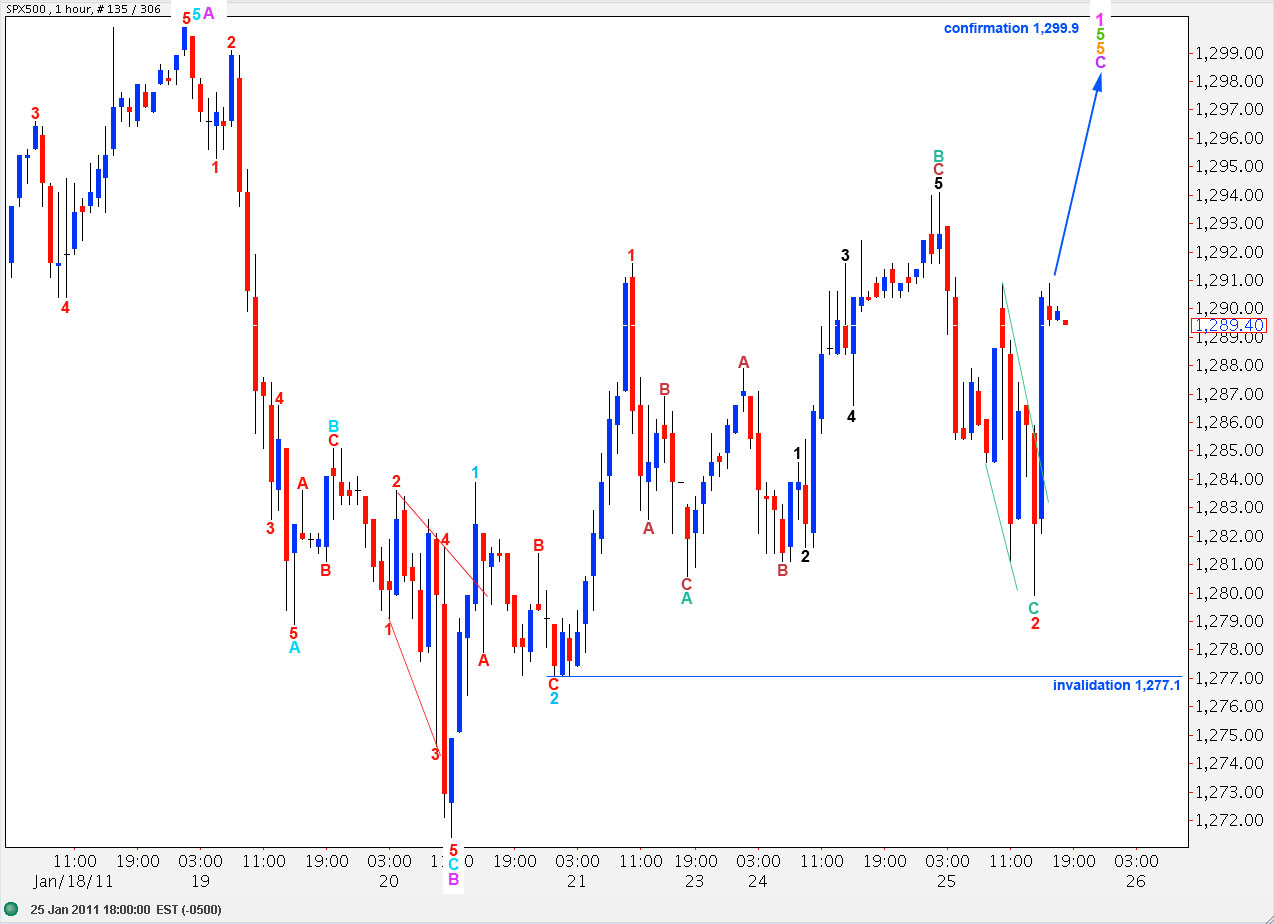
Movement below 1,280.6 invalidated the ending diagonal for wave C purple structure. Wave C purple must be, therefore, unfolding as a simple impulse.
If this wave count is correct then we need to see strong upward movement. Wave 3 red must move beyond the end of wave 1 red above 1,291.6. At 1,303.4 wave 3 red would reach 1.618 the length of wave 1 red.
Wave 2 red is an expanded flat correction. Wave C teal within it has no relationship to wave A teal.
Any further extension downward of wave 2 red may not move beyond the start of wave 1 red. Therefore, this wave count is invalidated with movement below 1,277.1.
The large size of wave 2 red to wave 2 aqua, one degree above, is out of proportion. This wave count may be technically possible still but it is looking less likely.
Alternate Hourly Wave Count.
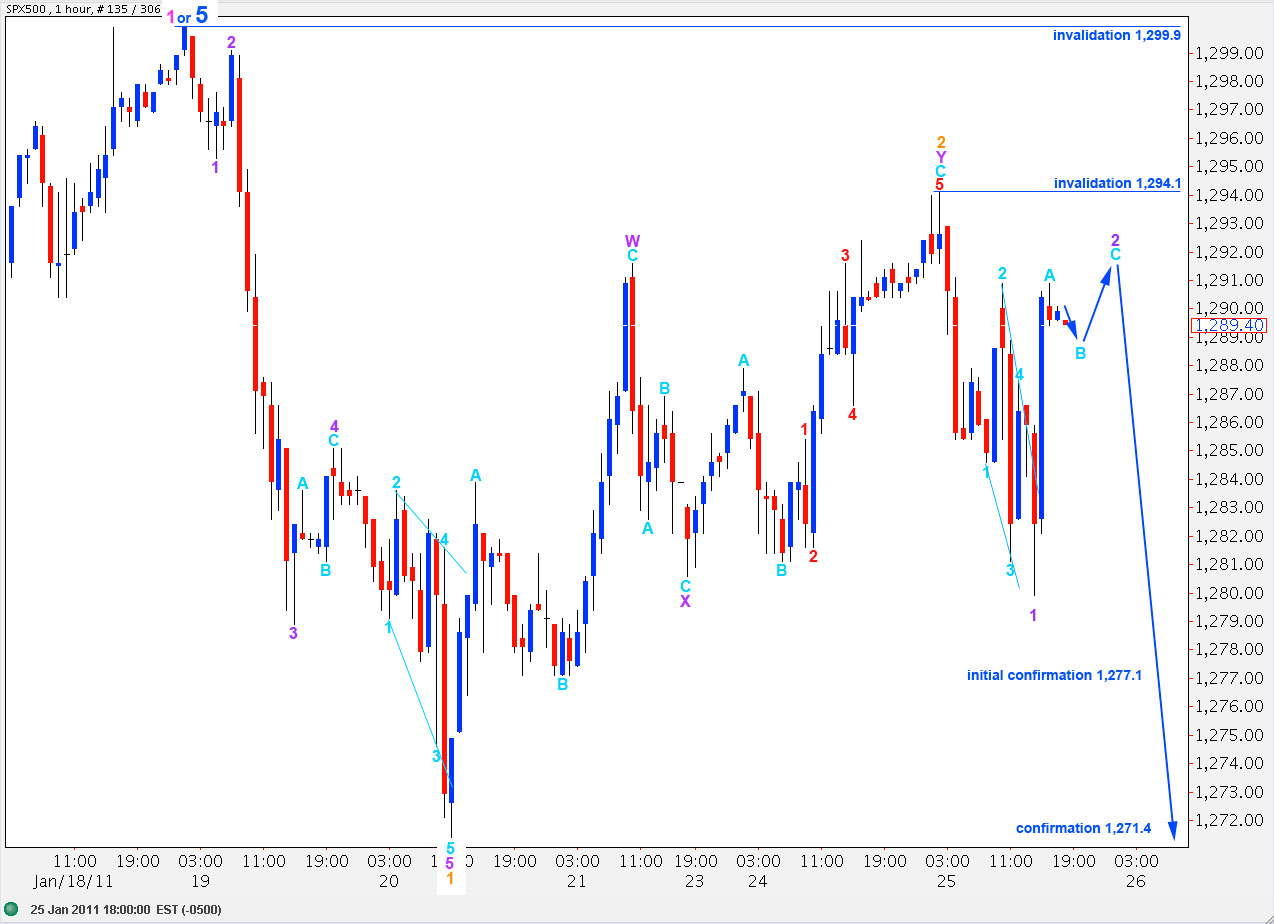
Because the main hourly wave count is beginning to look unlikely today I have taken another very close look at recent strong downward movement labeled here 1 orange, particularly the piece labeled 3 purple within wave 1 orange.
When viewed on a 15 minute chart this downward movement has a corrective wave count. When viewed on a 10 minute chart it has an impulsive count. Therefore, I am willing to entertain the possibility that this was a third wave.
Wave 2 orange is a double zigzag correction. Wave Y purple within it is just 1 point longer than 0.618 the length of wave W purple.
Within wave Y purple there is no relationship between waves A and C aqua.
Within wave X purple wave C aqua is 0.7 points short of 0.618 the length of wave A aqua.
Within wave Y purple wave C aqua is 1.2 points longer than 1.618 the length of wave A aqua.
Wave 2 orange was a deep 80% correction of wave 1 orange. Therefore, wave 3 orange is likely to be 1.618 the length of wave 1 orange. This gives us a downward target of 1,248.1.
Any further upward extension of wave 2 purple may not move beyond the start of wave 1 purple above 1,294.1.
If this point is invalidated it may be that wave 2 orange is extending higher as a very rare triple combination. At that stage the invalidation point may be moved to 1,299.9. However, at that stage the possibility of a trend change having occurred at 1,299.9 would be very low as triple combinations are very rare structures indeed.