
Elliott Wave chart analysis for the SPX500 for 21st January, 2011. Please click on the charts below to enlarge.
Movement above 1,285.1 confirmed the main hourly wave count and invalidated the alternate. At that stage we expected the S&P to continue to rise.
We do not have confirmation yet of a trend change, although we expect it is coming soon. If wave 5 blue has a fibonacci time duration of 55 days (+/- 2 days) it may end as early as Wednesday. It is not necessary that we see a new high, wave C of wave 5 orange zigzag may be truncated, but it is most likely that we shall see a new high.
The bearish engulfing candlestick pattern remains intact and may be indication of a trend change. This candlestick pattern does not have to occur exactly at the point of the trend change; it is an indicator of an imminent trend change.
We also have a perfect double top.
Friday’s candlestick moved back into the small trend channel drawn as a best fit around most recent upward movement. We do not have a trend channel breach to indicate a trend change.
In the short term movement below 1,253.4 would provide confirmation of a trend change.
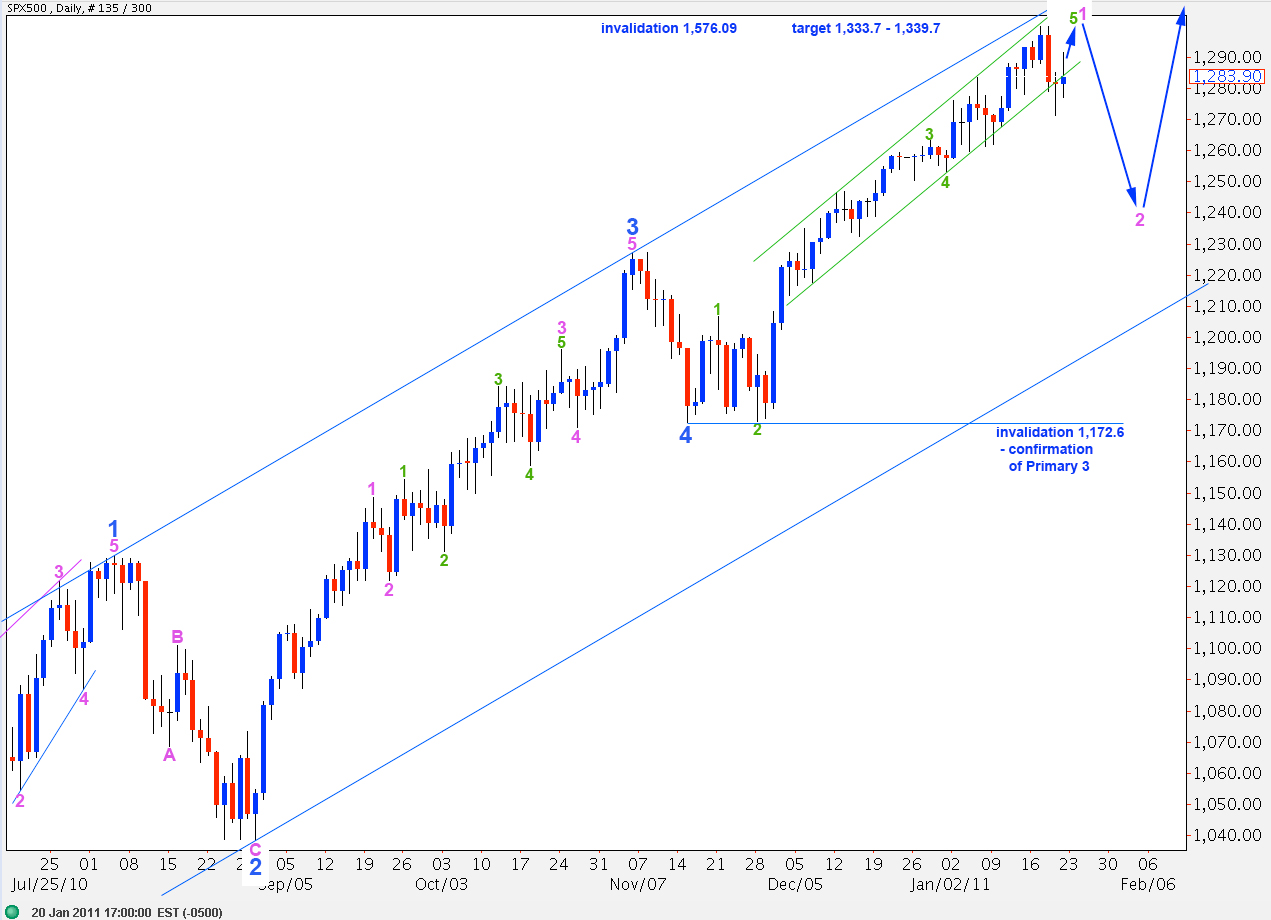
By moving the degree of labeling since the end of wave 4 blue up one degree we may be nearing the end of primary wave 2.
When upward movement is over and we have a trend change confirmed with movement below 1,253.4 then we should expect some very strong downward movement if this degree of labeling is correct. We will have an end to primary wave 2 confirmed when price moves below 1,172.6 as at that stage the main daily wave count will be invalid; downward movement may not be a smaller second wave correction.
With movement above 1,285.1 this wave count was confirmed. Downward movement from the high at 1,299.9 has a strong three wave look. It would be difficult to see that as an impulse.
When the trend has changed we would expect to see a clear five wave structure develop to the downside. We do not now have that.
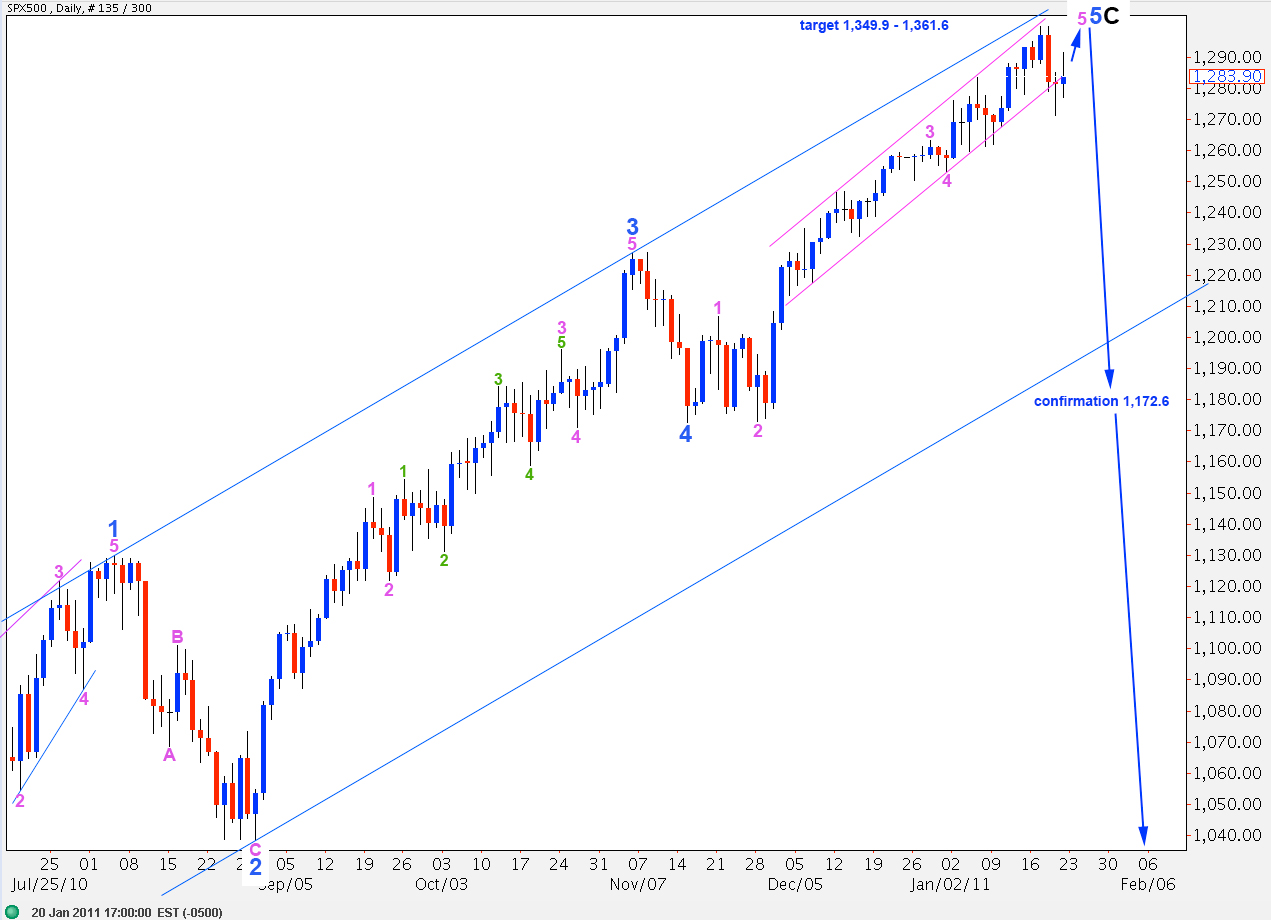
This wave count sees the S&P as completing one final impulse to the upside for a C wave to end a fifth wave zigzag of an ending diagonal for wave 5 green.
At 1,295.2 wave C purple would reach 0.618 the length of wave A purple. At 1,309.9 wave C purple would reach equality with wave A purple.
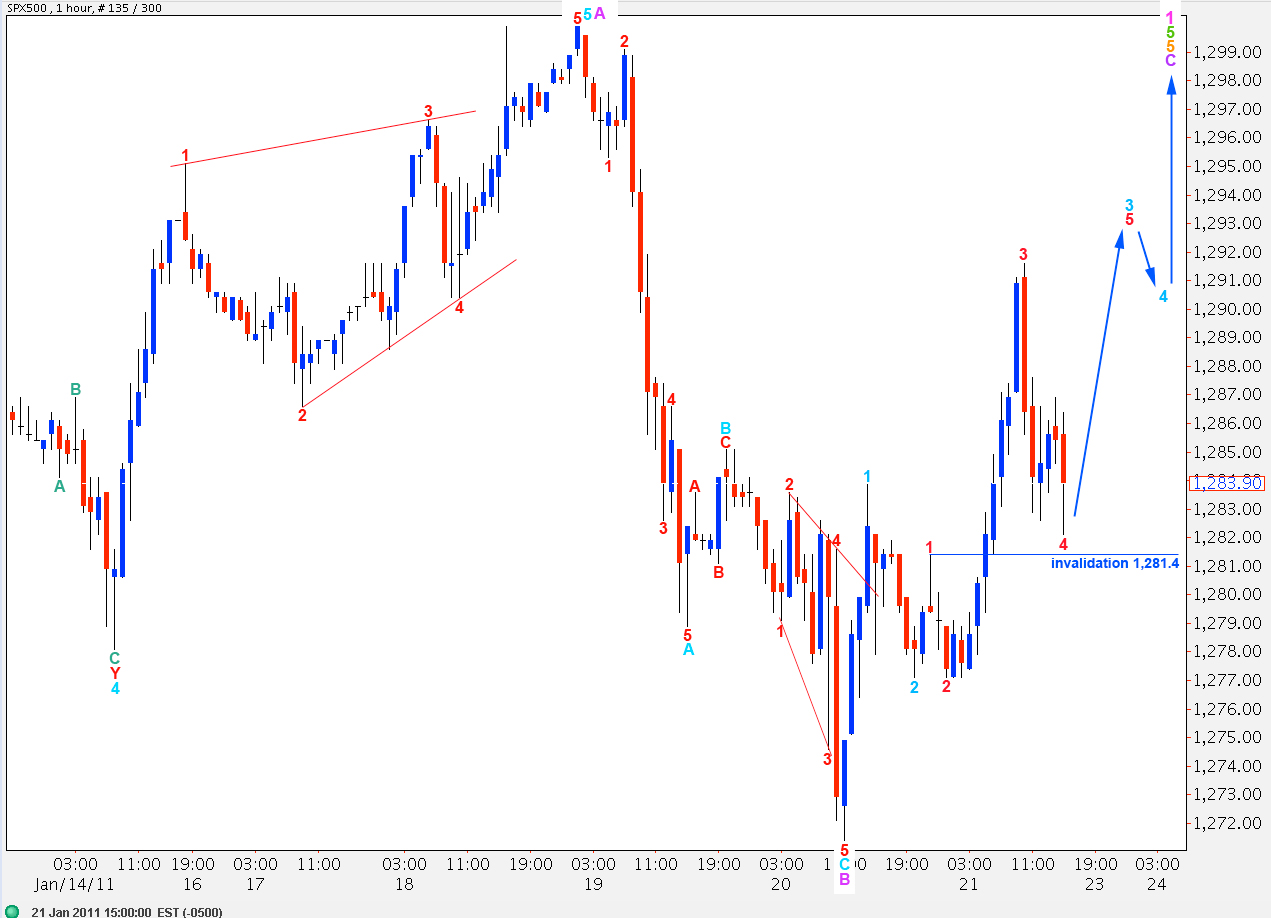
This C wave requires three more waves to satisfy an impulsive wave count.
If the invalidation point at 1,281.4 is breached then we may expect wave C purple is an ending diagonal, and the invalidation point would move down to 1,271.4. Wave 2 of the diagonal may not move beyond the start of wave 1.
Movement below 1,271.4 would at this stage provide strong indication of a trend change.