Elliott Wave chart analysis for the SPX500 for 20th January, 2011. Please click on the charts below to enlarge.
Downward movement continues as expected for both hourly wave counts.
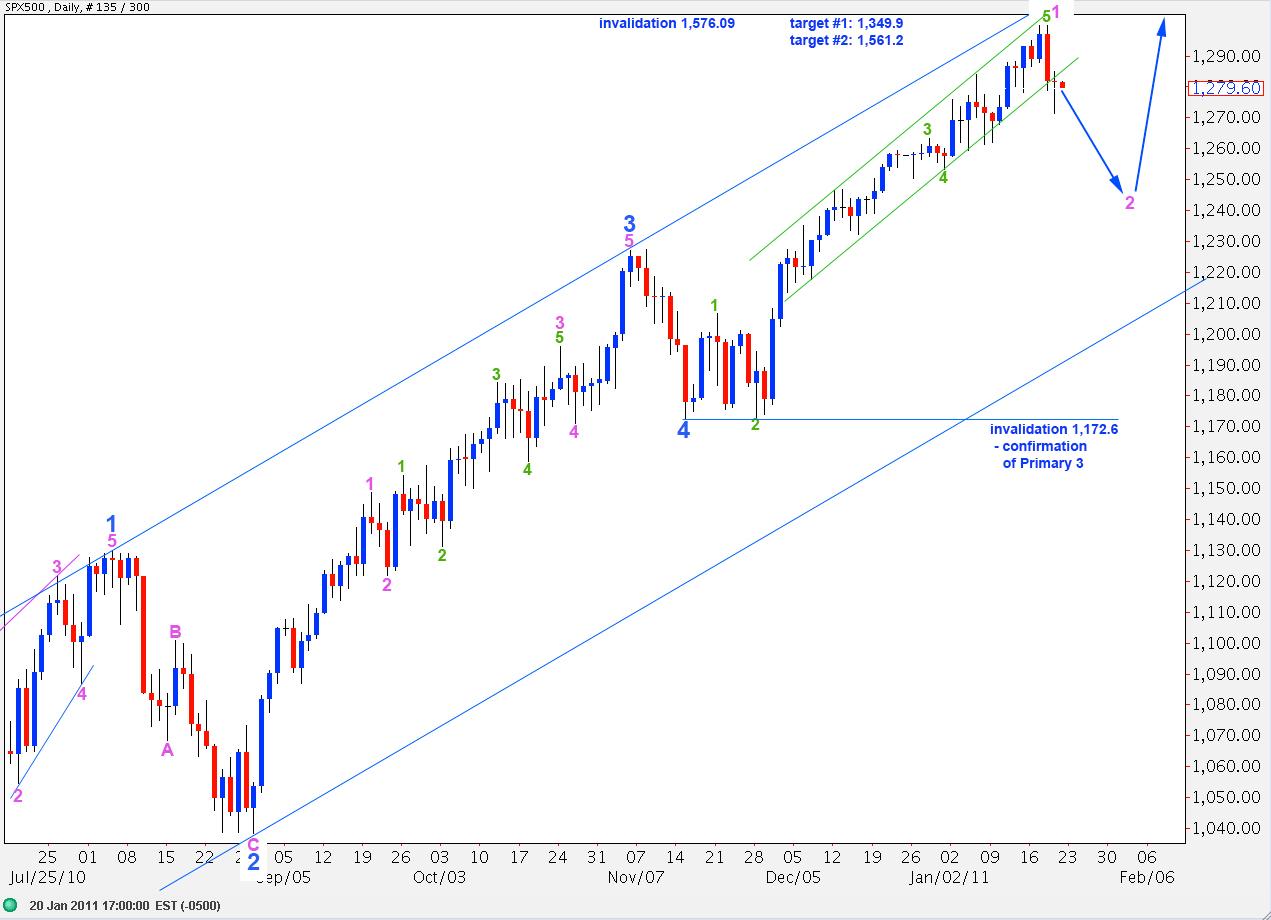
We now have a bearish candlestick pattern and reasonable movement outside the lower edge of the small parallel channel here on the daily chart containing recent upward movement. We would want to see today’s candlestick remain outside this channel, and end without touching the channel, if we have seen a trend change. If we have yet higher highs to occur before a trend change then we would expect today’s candlestick to move back into the trend channel.
In the short term movement below 1,253.4 would provide confirmation of a trend change.
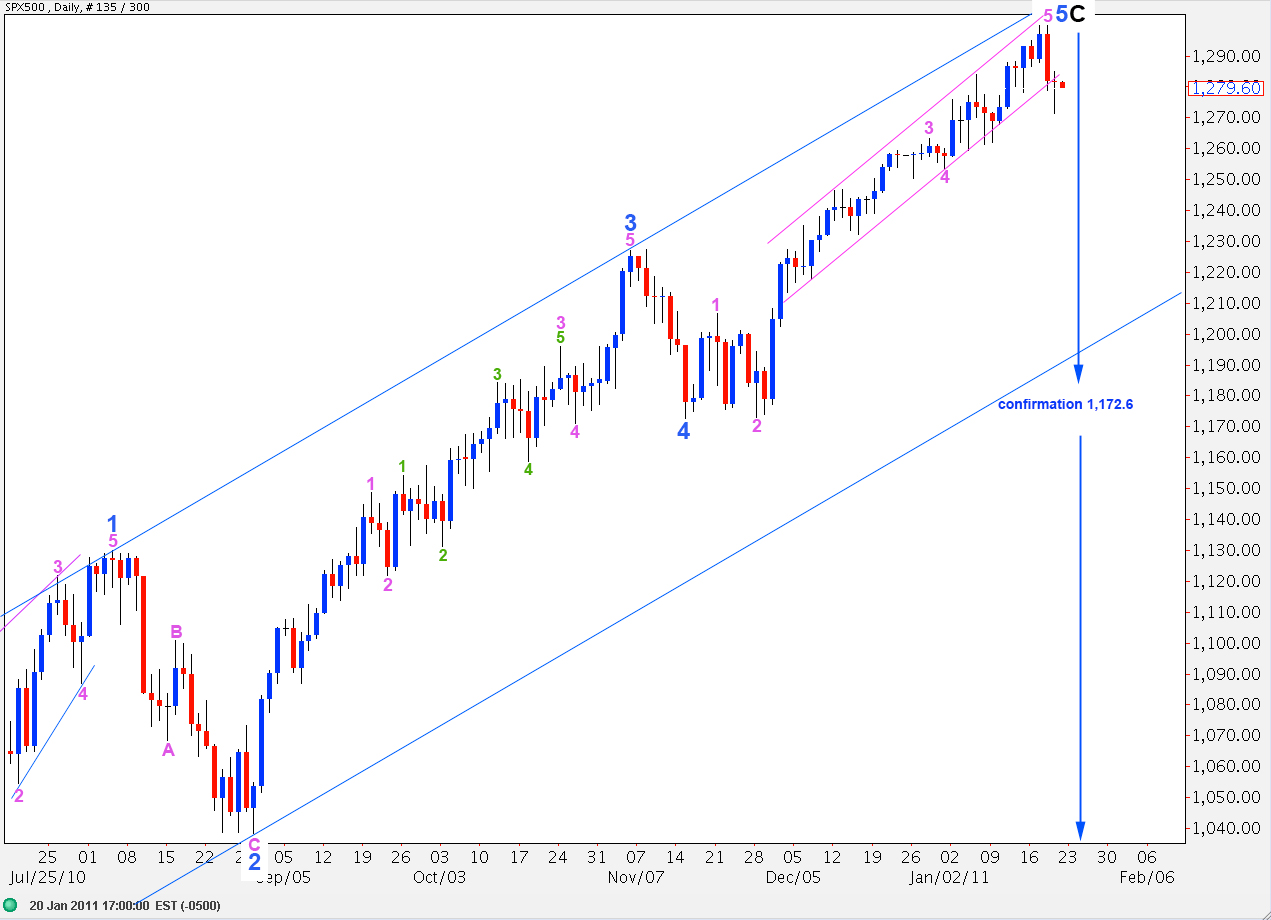
Only movement below 1,172.6 would confirm an end to primary wave 2 and indicate that primary wave 3 is underway.
This degree of labeling would be confirmed with movement below 1,172.6 because at that stage downward movement would not be a second wave correction within wave 5 blue.
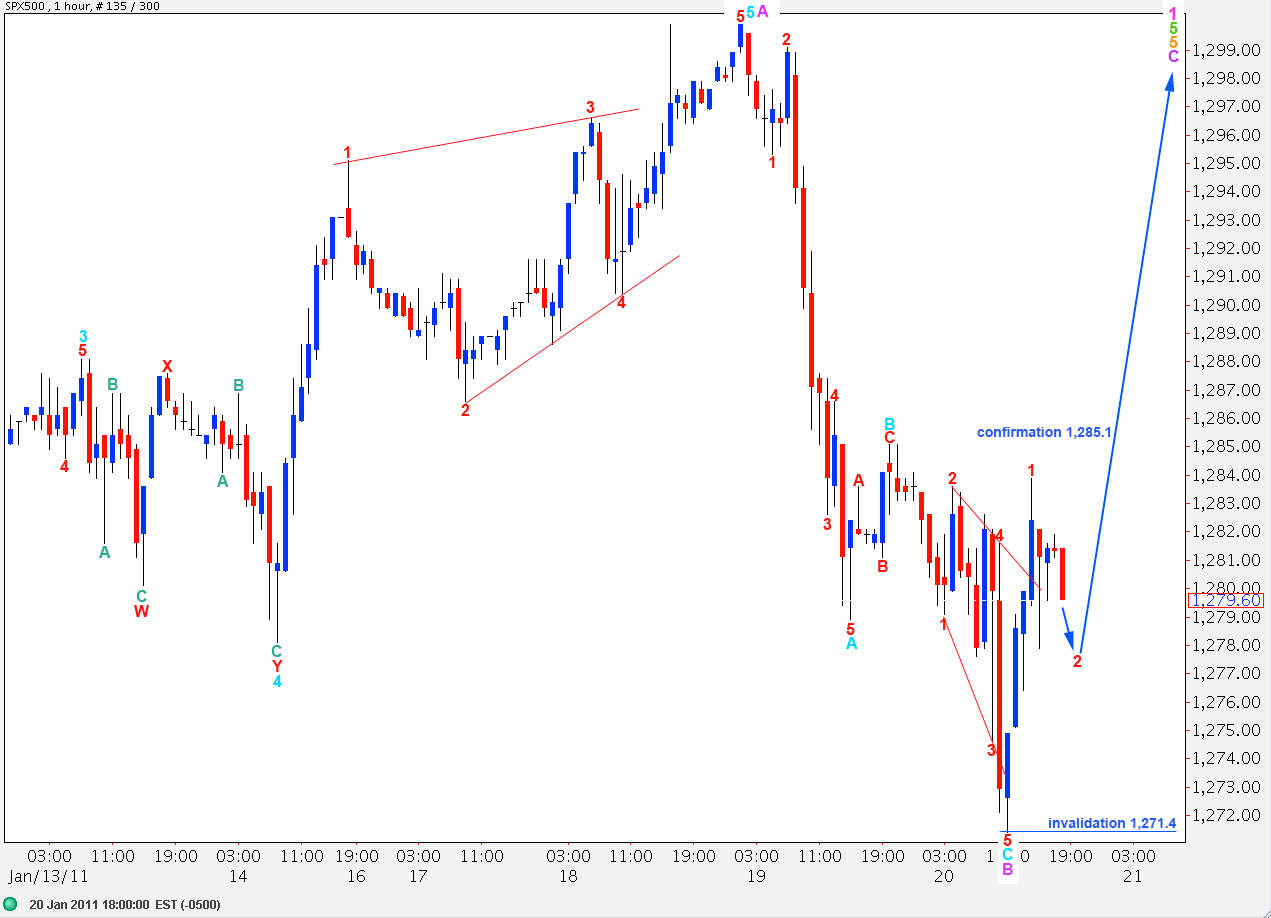
Main Hourly Wave Count.
We can see a satisfactory three wave structure downward now for wave B purple. Wave C aqua within it is just 0.72 longer than 0.618 the length of wave A aqua.
If this wave count is correct we should not see price move below 1,271.4 as wave 2 red within wave C purple may not move beyond the start of wave 1 red.
We will have initial confirmation of this wave count with price movement above 1,285.1 today. At that stage the alternate wave count below would be invalid.
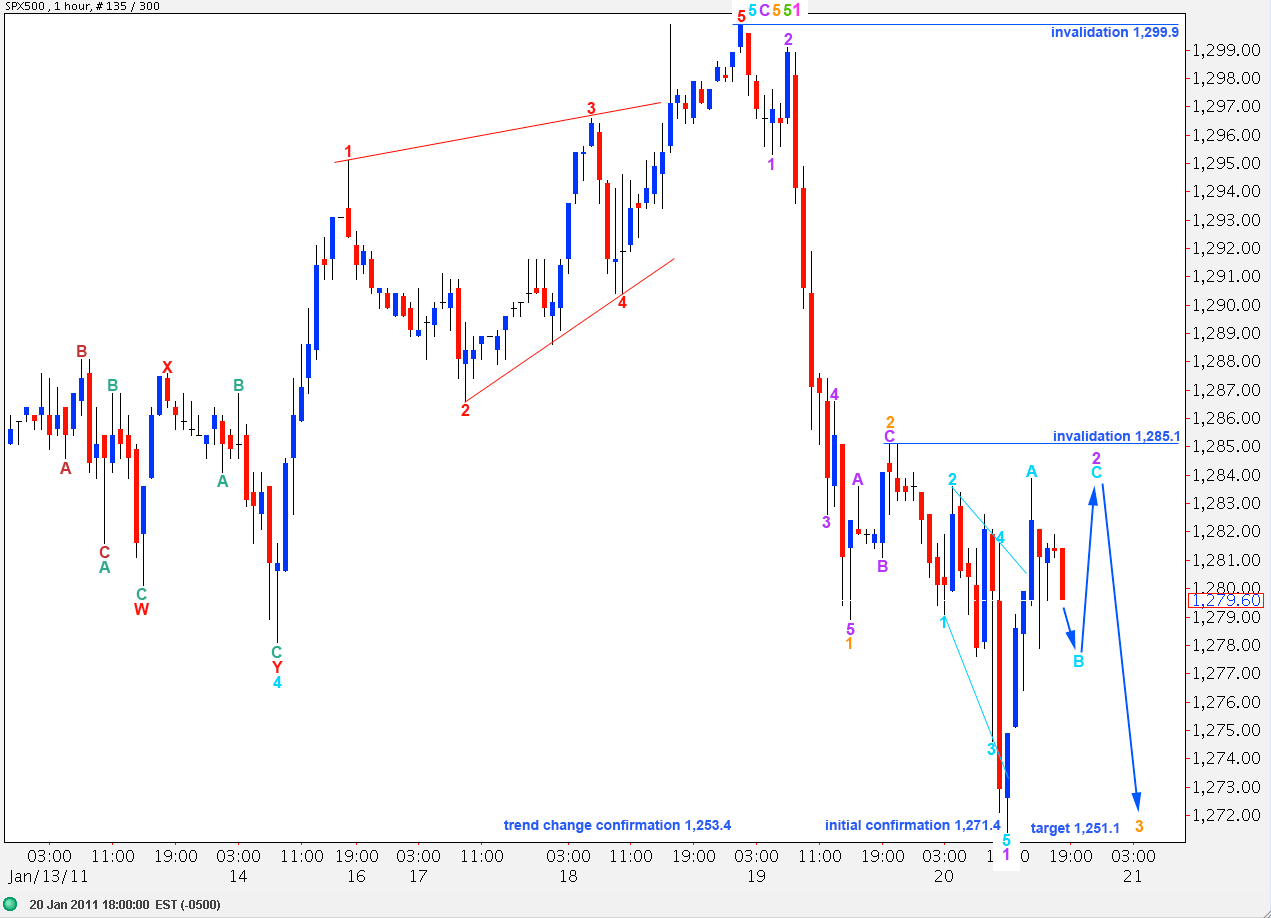
Alternate Hourly Wave Count.
If we have seen a trend change then we need to see what is so far a three to the downside continue to develop into a five.
At this stage movement above 1,285.1 would invalidate this wave count as wave 2 purple may not move beyond the start of wave 1 purple.
At 1,251.1 wave 3 orange would reach 1.618 the length of wave 1 orange, and we would have confirmation of a trend change at least at minute degree.
Below 1,271.4 the main hourly wave count will be invalid. At that stage it will look increasingly likely that we are seeing a five develop to the downside which is what would be expected if the trend is now down.


