Elliott Wave chart analysis for the SPX500 for 18th January, 2011. Please click on the charts below to enlarge.
The trend remains up until proved otherwise and at this stage we do not have indication nor confirmation of a trend change. This is an expiring trend, however. In another 8 trading days blue wave 5 will have lasted a fibonacci 55 days. This will be next Friday, the 28th of January. We may see a trend change on this day or one to two days either side of this date.
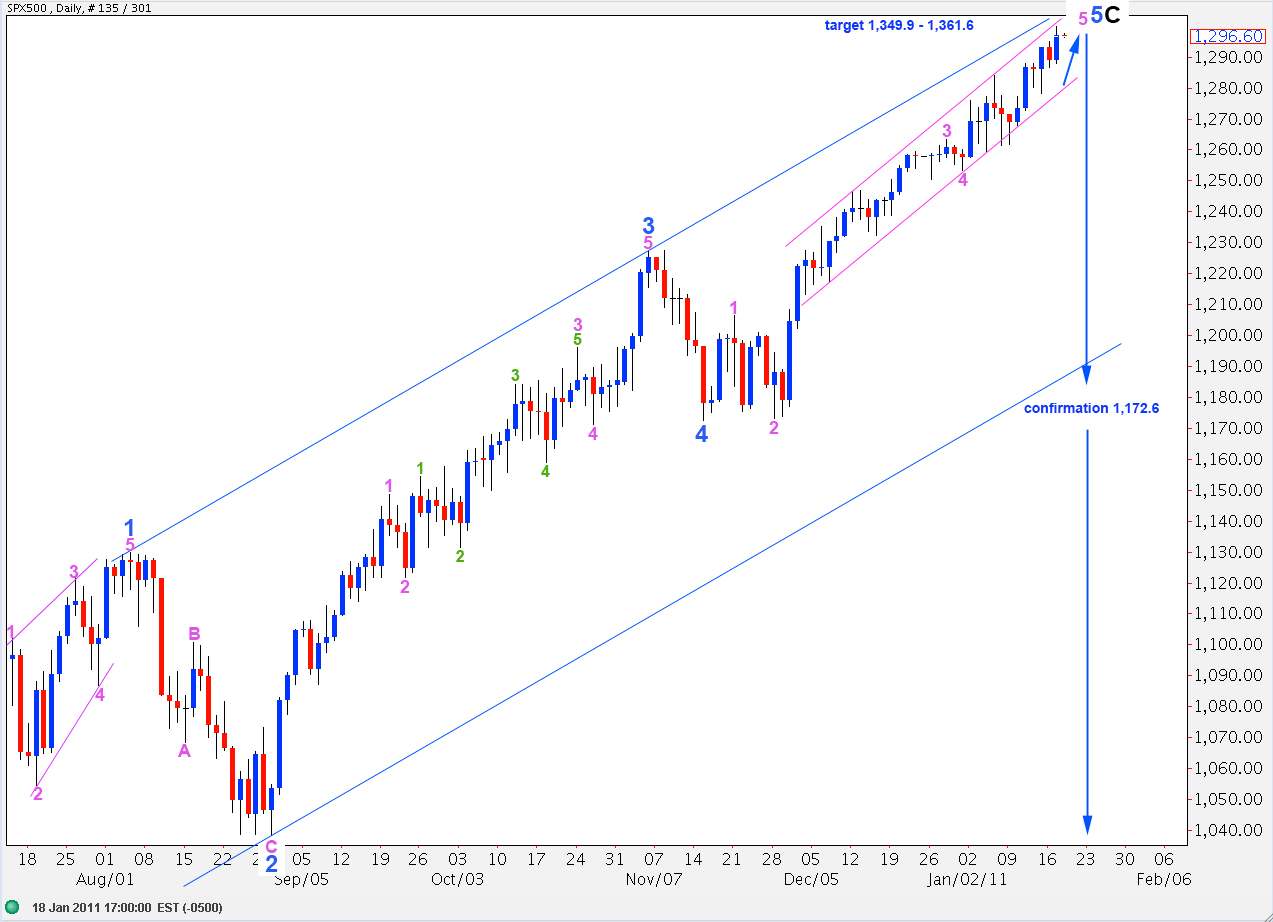
We may see price rise higher towards a target which allows for a relationship between intermediate (black) waves A and C. At 1,349.9 wave C will reach 0.618 the length of wave A and at 1,561.2 wave C black will reach equality with wave A.
Movement below 1,253.4 will indicate a trend change to the downside.
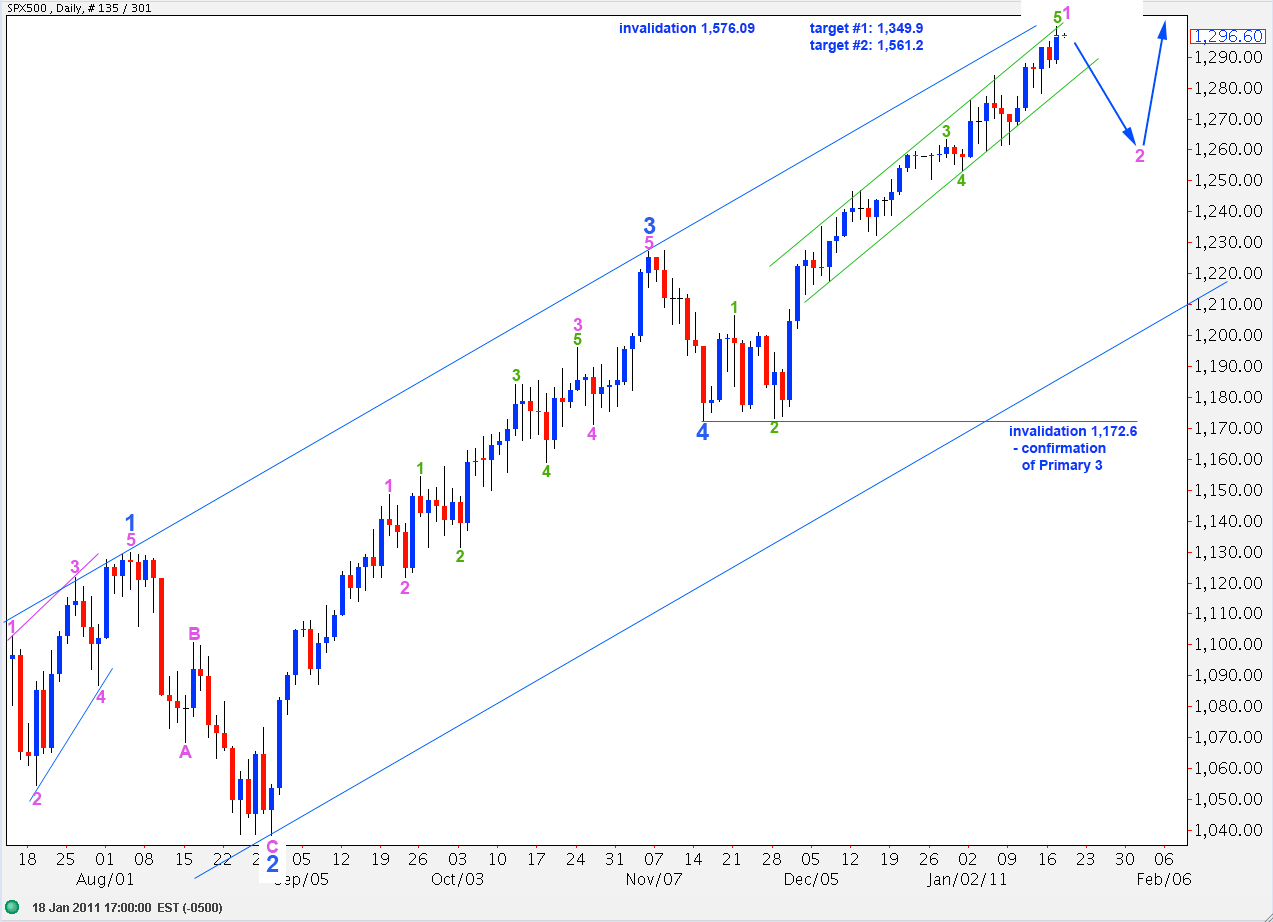
I have drawn a “best fit” small parallel channel around recent upward movement. Price is again at the upper end of the channel range. When we see significant movement below the channel we may have our first indication of a trend change. Until that time we may expect this channel to mostly contain upward movement.
This is the same wave count only the degree of labeling since the end of wave 4 blue is here moved up one degree.
If price moves below 1,172.6 we may consider primary wave 3 is underway because at that stage downward movement may not be a second wave correction within wave 5 blue.
We will have final confirmation with elimination of a slim outlying alternate possibility when price moves below 1,129.9.
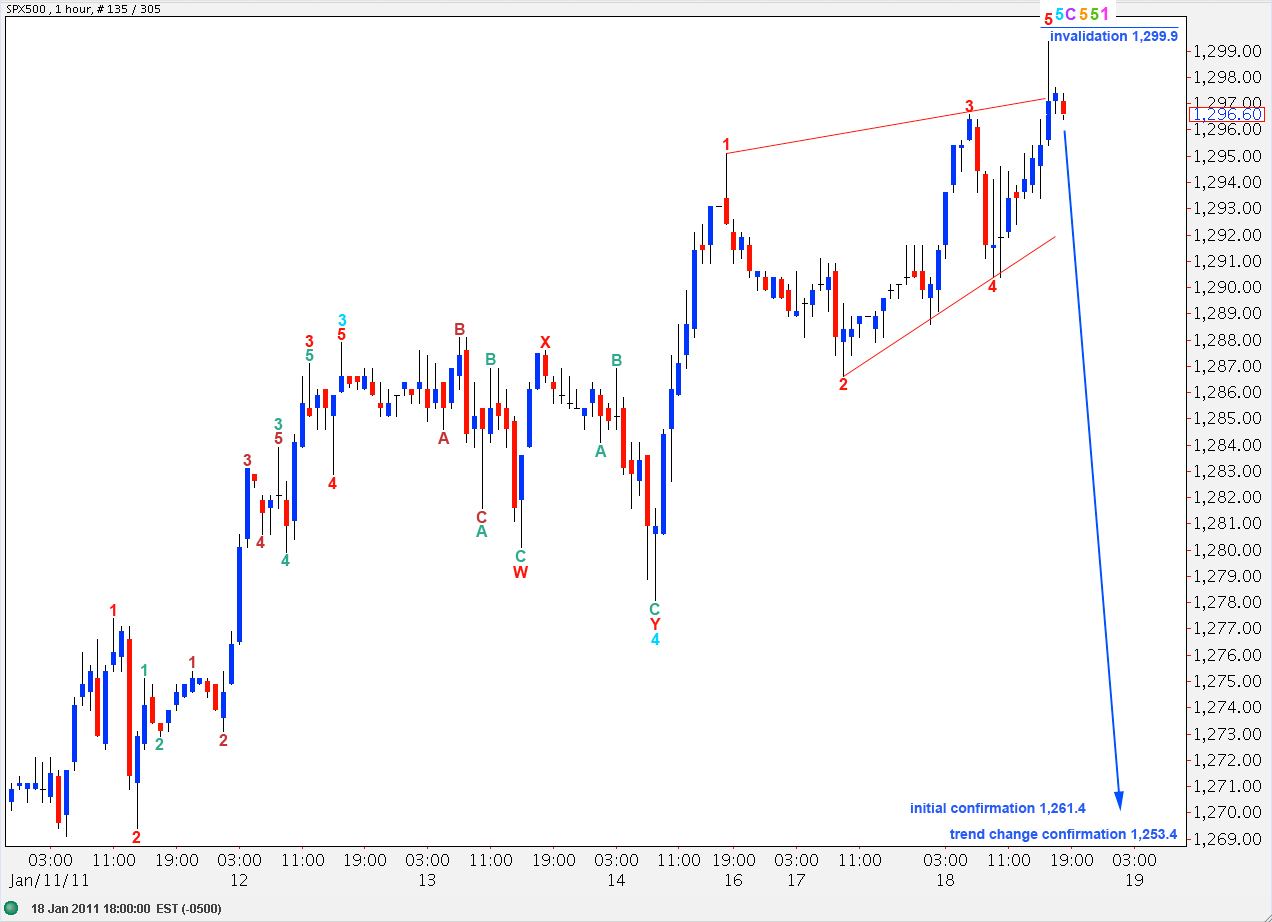
Main Hourly Wave Count.
This wave count sees an end to upward movement.
If upward movement is over then wave 5 green is 6.8 points short of 0.618 the length of wave 3 green (seen on the first daily chart).
If this wave count here is moved up one degree for the second daily chart then wave C black still has no fibonacci ratio to wave A black.
Ratios at blue degree would be: blue wave 3 is 8.2 points short of 1.618 the length of blue wave 1 and blue wave 5 if it was over here would be 5.4 points longer than equality with blue wave 1.
If price moves below 1,261.4 then our main hourly wave count will be invalidated.
We will only have confirmation of a trend change, at least at minute degree, when price moves below 1,253.4.
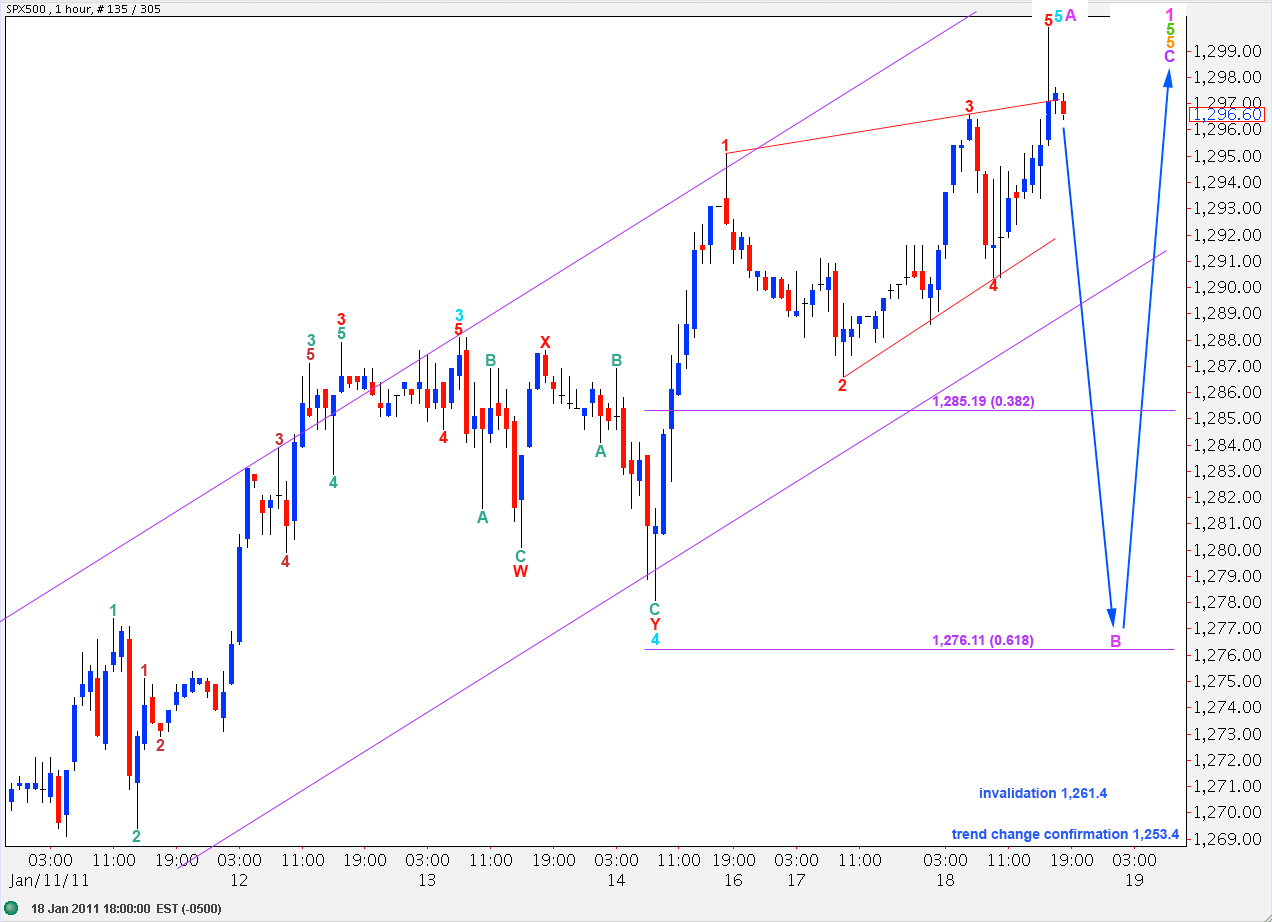
Hourly Alternate Wave Count.
Upward movement may have ended a five wave structure for wave A purple being the first wave of a zigzag for wave 5 orange, the last zigzag of an ending expanding diagonal for wave 5 green.
Wave B purple may correct to a fibonacci ratio of wave A purple and the 0.618 ratio may be more likely about 1,276.11.
Thereafter, a final five wave structure upward should end this ending diagonal for wave 5 green.
This wave count allows for further upward movement which may give better fibonacci ratios, especially at intermediate degree.


