
Elliott Wave chart analysis for the SPX500 for 14th January, 2011. Please click on the charts below to enlarge.
Upward movement was not over and our alternate hourly wave count was correct.
I have two hourly wave counts again for you to end the trading week. We can still see a completed expanding ending diagonal for wave 5 green and upward movement may have been over on Friday, at least for the short term.
When we see the trend change we are expecting it will be confirmed when price moves below 1,253.4. At that stage downward movement may not be a second wave correction within wave 5 green and, therefore, 5 green must be over.
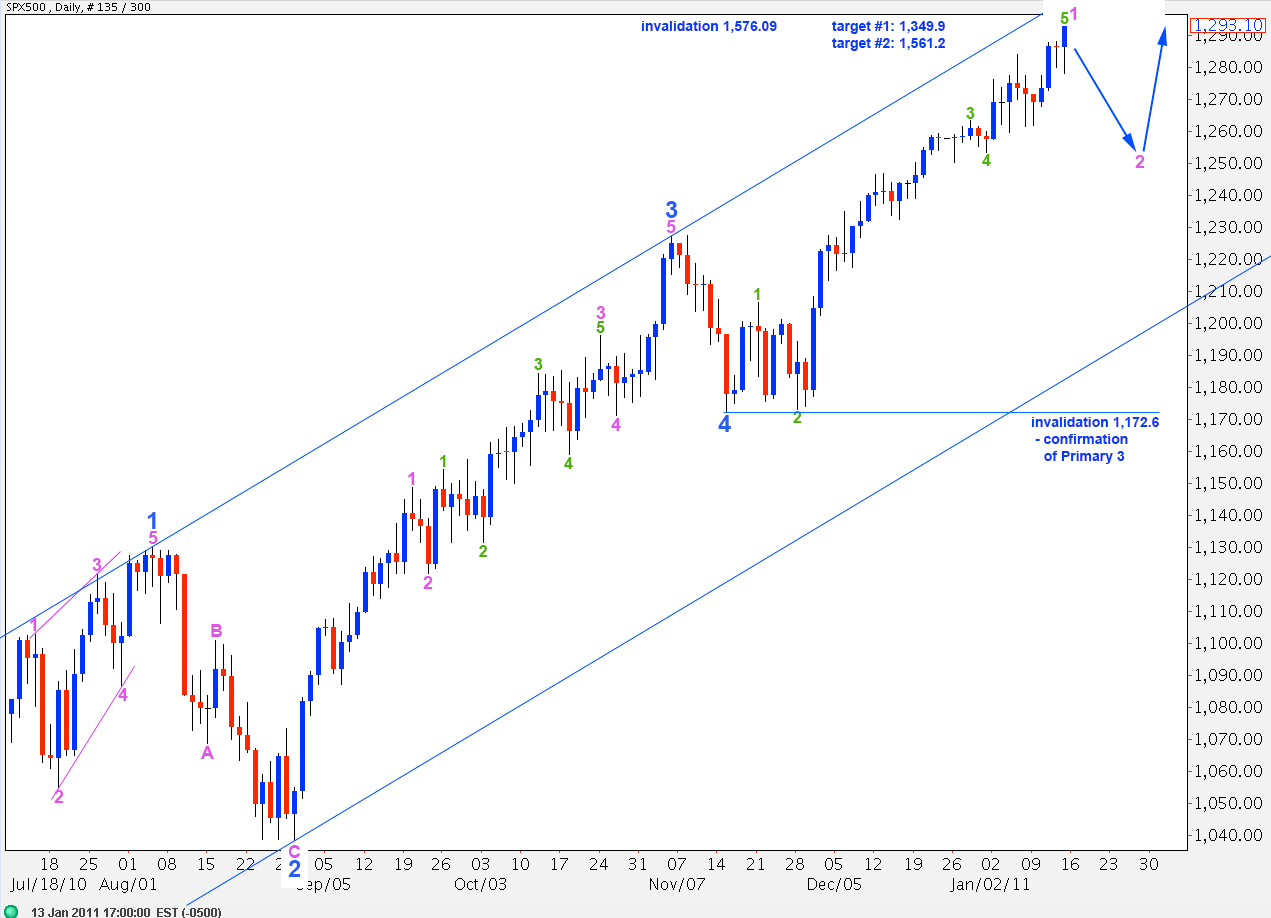
This degree of labeling expects the trend change will be at minute degree. A second wave at minute degree may last only a few days, up to about a week or so. It should not take price outside the lower edge of the wide blue parallel channel drawn here on the daily chart.
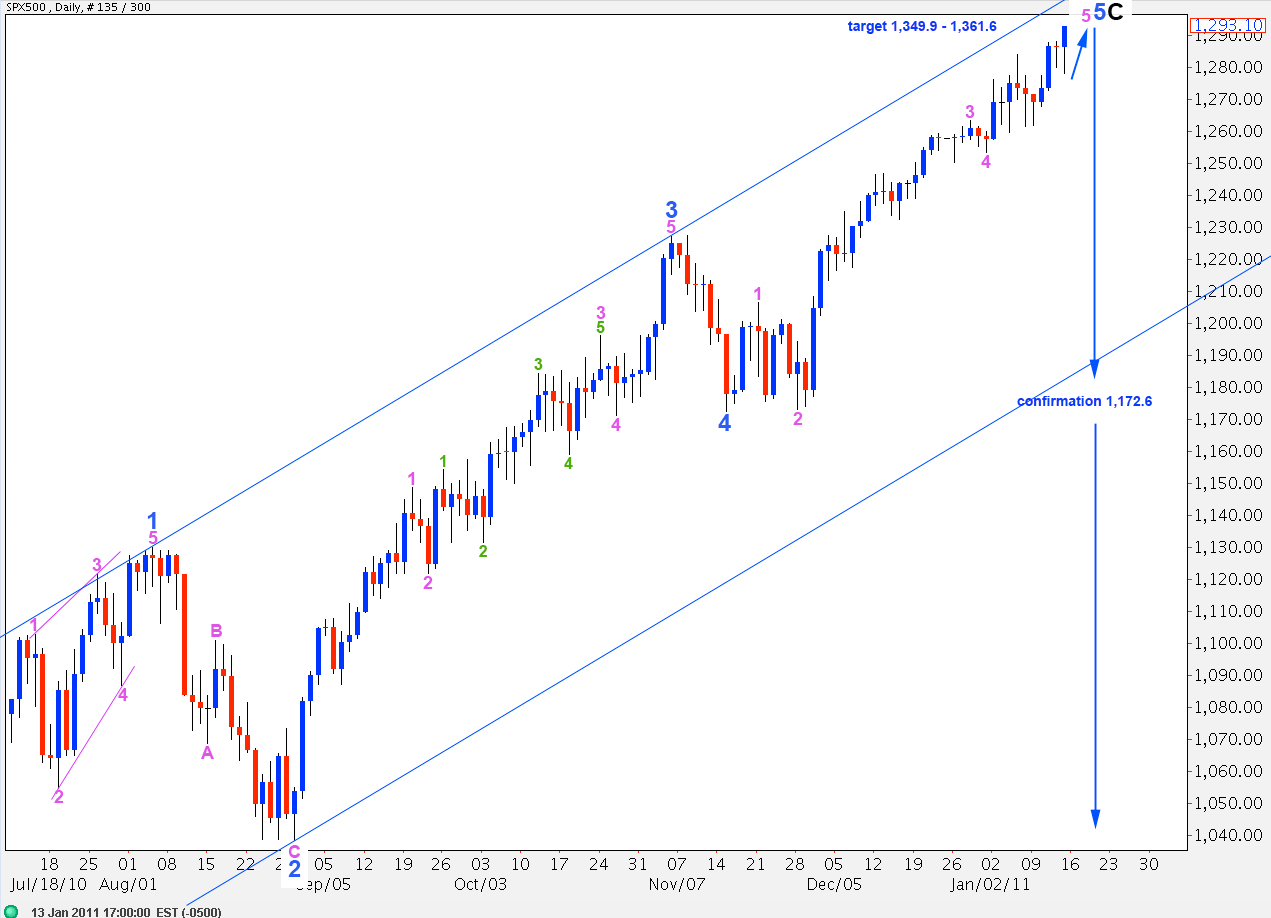
Wave 2 pink may not move below the start of wave 1 pink. Therefore, this degree of labeling for wave 5 blue is invalidated below 1,172.6.
If this degree of labeling is correct then we may expect that the S&P is likely to be either at its turning point, or extremely close.
If we move the degree of labeling for wave 5 blue up one degree then we may be on the verge of a trend change at primary degree.
If this degree of labeling is correct then I would expect some more upward movement before a trend change.
At 1,349.6 black wave C will reach 0.618 the length of black wave A. At 1,361.6 blue wave 5 will reach equality with blue wave 3.
If price moves below 1,172.6 we may consider primary wave 3 is underway.
We will have final confirmation with elimination of a slim outlying alternate possibility when price moves below 1,129.9.
Main Hourly Wave Count.
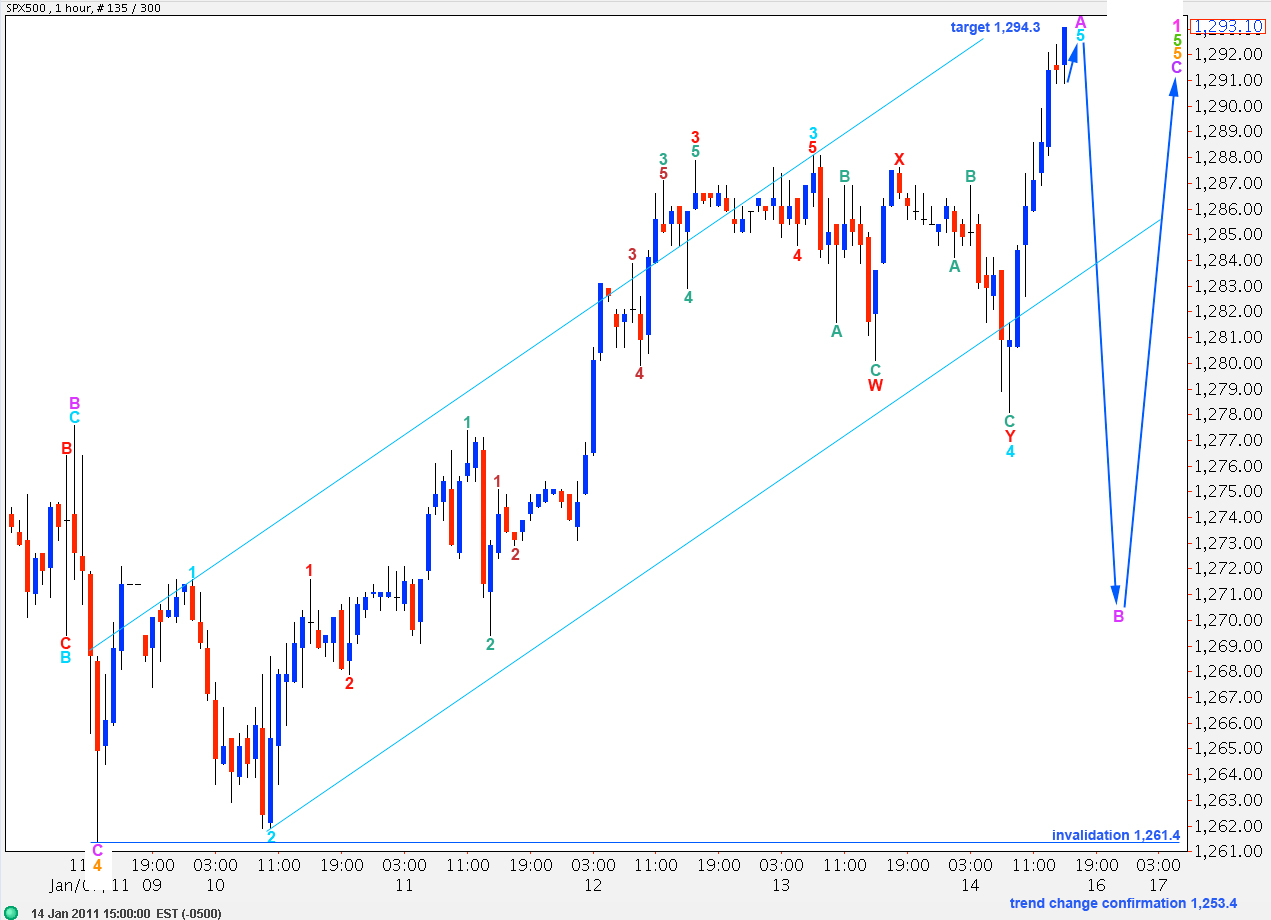
Wave 5 orange to end this ending expanding diagonal for wave 5 green may be unfolding as an exaggerated zigzag structure.
At 1,294.3 wave 5 aqua will reach 0.618 the length of wave 3 aqua. Wave 3 aqua is just 0.5 points short of 2.618 the length of wave 1 aqua.
This hourly wave count expects a three wave structure (or possibly a triangle) toward the downside for a B wave of wave 5 orange. Thereafter, wave 5 orange zigzag will require a final C wave to complete it.
The trend channel drawn here is Elliott’s technique for an impulse. Wave 4 aqua double zigzag correction has a strong overshoot of the channel. This may indicate an overshoot in the opposite direction for wave 5 aqua to end wave A purple.
When wave A purple is complete we may draw a fibonacci retracement along it and use the fibonacci ratios as targets for downward movement for wave B purple.
The nature and wave structure of downward movement will indicate if it is a B wave or if it is the start of a new downward trend.
Alternate Hourly Wave Count.
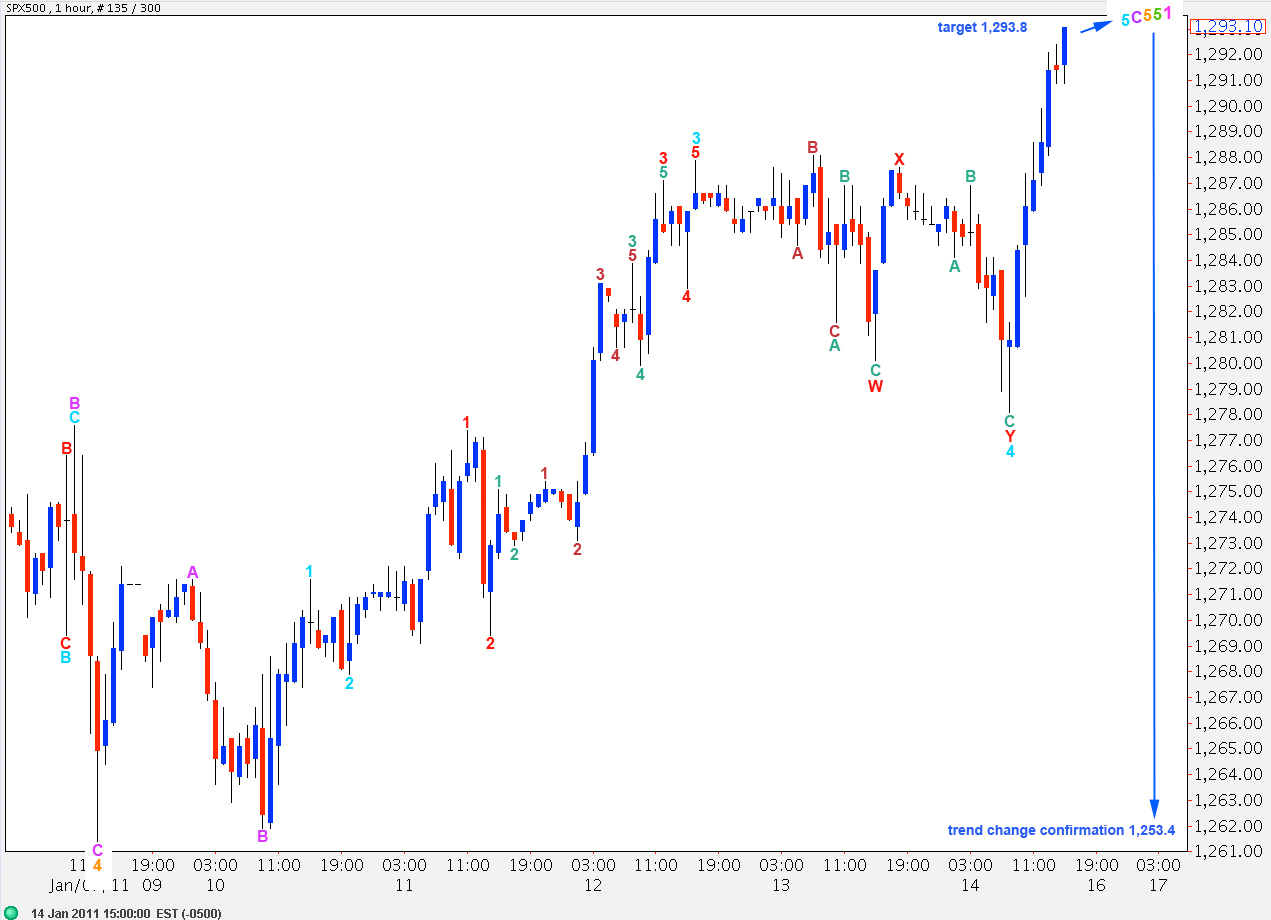
This wave count expects an imminent turn to the downside. It is possible to see a complete structure for wave 5 orange and, therefore, wave 5 green and 1 pink.
At 1,293.8 wave 5 aqua will reach 1.618 the length of wave 1 aqua.
The fibonacci ratios and overall look for wave 5 orange are not as good as the main hourly wave count. Therefore, I favour this alternate slightly less.