
Elliott Wave chart analysis for the SPX500 for 10th January, 2011. Please click on the charts below to enlarge.
The S&P has moved sideways for the last session so the situation is pretty much unchanged.
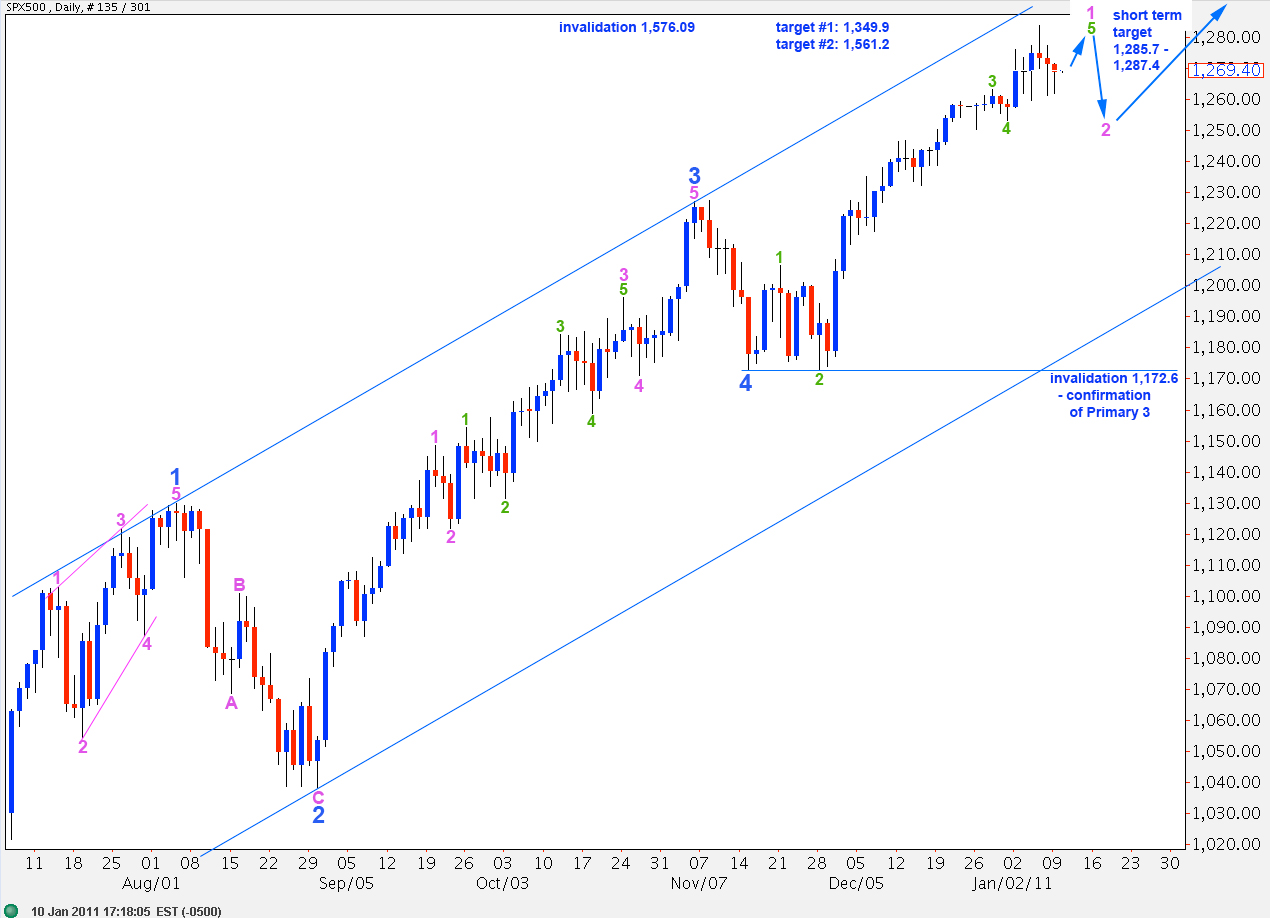
This wave count sees the S&P as requiring one final upward wave to reach at least to 1,285.7 most likely before a trend change.
At 1,285.7 wave 5 orange within wave 5 green will reach equality with wave 3 orange and at 1,287.4 wave 5 green will reach equality with wave 1 green. This is our target zone for upward movement to end.
While price is above 1,172.6 any trend change to the downside will be either at minute degree, or at primary degree. Only if price moves below 1,172.6 will we know that there has been a trend change at primary degree.
This wave count is at this stage more likely. We are expecting a trend change at minute degree for a second wave correction. This second wave is most likely to correct to about the fourth wave of one lesser degree at 1,253.4. When we have a satisfactory structure upward for wave 5 green then we may draw a fibonacci retracement for wave 1 pink and use the fibonacci ratios as targets for wave 2 pink.
Wave C black is most likely to find a relationship with wave A black. At 1,561.2 wave C black will reach equality with wave A black and as this is the most common relationship between waves A and C of a zigzag this is the most likely target for wave C black to end.
Upward movement may not make a new high above 1,576.09 as primary wave 2 may not move beyond the start of primary wave 1.
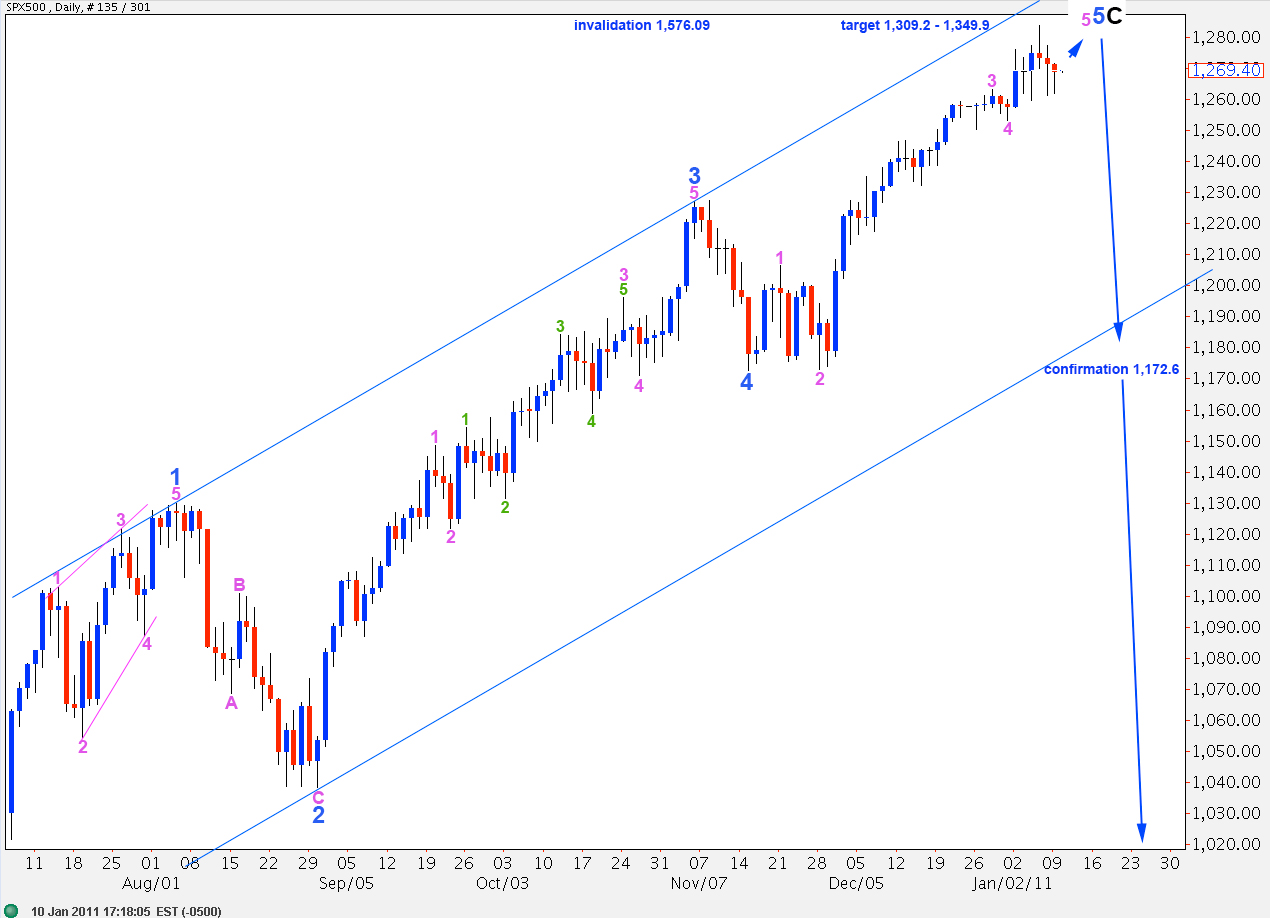
This wave count is the same as that presented above, with the only difference being the degree of labeling since the end of wave 4 blue.
At 1,309.2 green wave 5 will reach 0.618 the length of green wave 3. At 1,349.9 black wave C would reach 0.618 the length of black wave A. There would be no fibonacci ratio between blue wave 5 and either 1 or 3 blue.
The hourly chart below is for both interpretations of the daily chart. Only the degree of labeling differs.
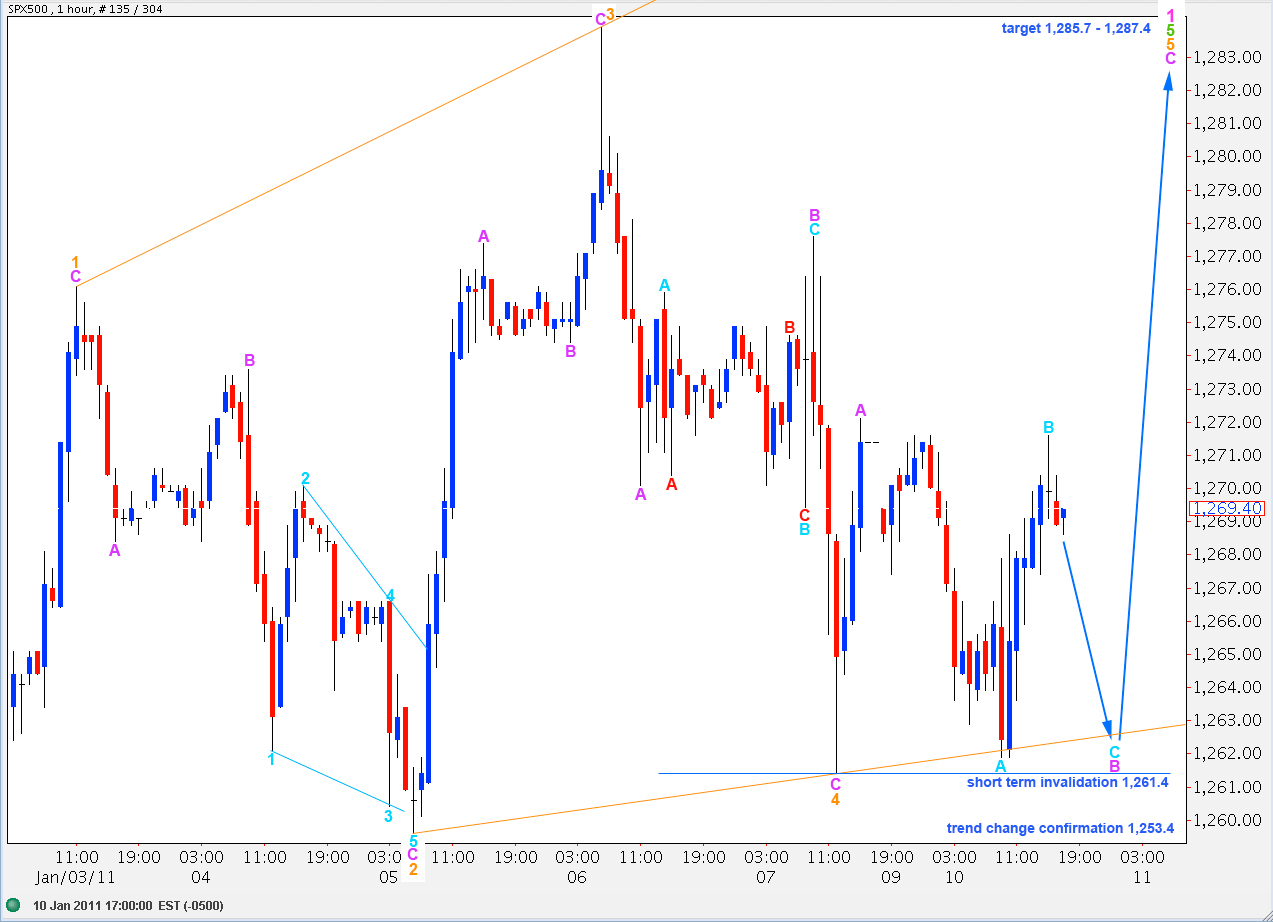
Price has remained above the invalidation point at 1,261.4. Therefore, this wave count remains valid.
Wave 5 orange should unfold as a zigzag.
Of recent sideways movement wave A aqua downward has a strong 5 wave look. It may have been a leading diagonal. Therefore, this is likely to be wave A aqua of wave B purple.
Wave B purple will reach equality with wave A purple at 1,261.4. Wave B may move to the start of wave A purple at 1,261.4, but it may not move beyond this point. Therefore, movement below 1,261.4 would invalidate this wave count.
If downward movement invalidates this wave count it may be only wave 4 orange extending further downward. At that stage the invalidation point would move to 1,259.6 as wave 4 orange may not end beyond the end of wave 2 orange for a diagonal.
Movement below 1,259.6 would see recent movement as an extension of wave 2 orange, and this seems fairly unlikely.
Only movement below 1,253.4 would indicate a trend change to the downside. At that stage we should expect overall downward movement from the S&P for at least a week or two, and possibly longer.