
Elliott Wave chart analysis for the SPX500 for 6th January, 2011. Please click on the charts below to enlarge.
Movement above 1,282.2 has invalidated the main daily wave count. Wave 4 blue must be over; it cannot now be continuing as an expanded flat correction. What was our alternate daily wave count is now our main count.
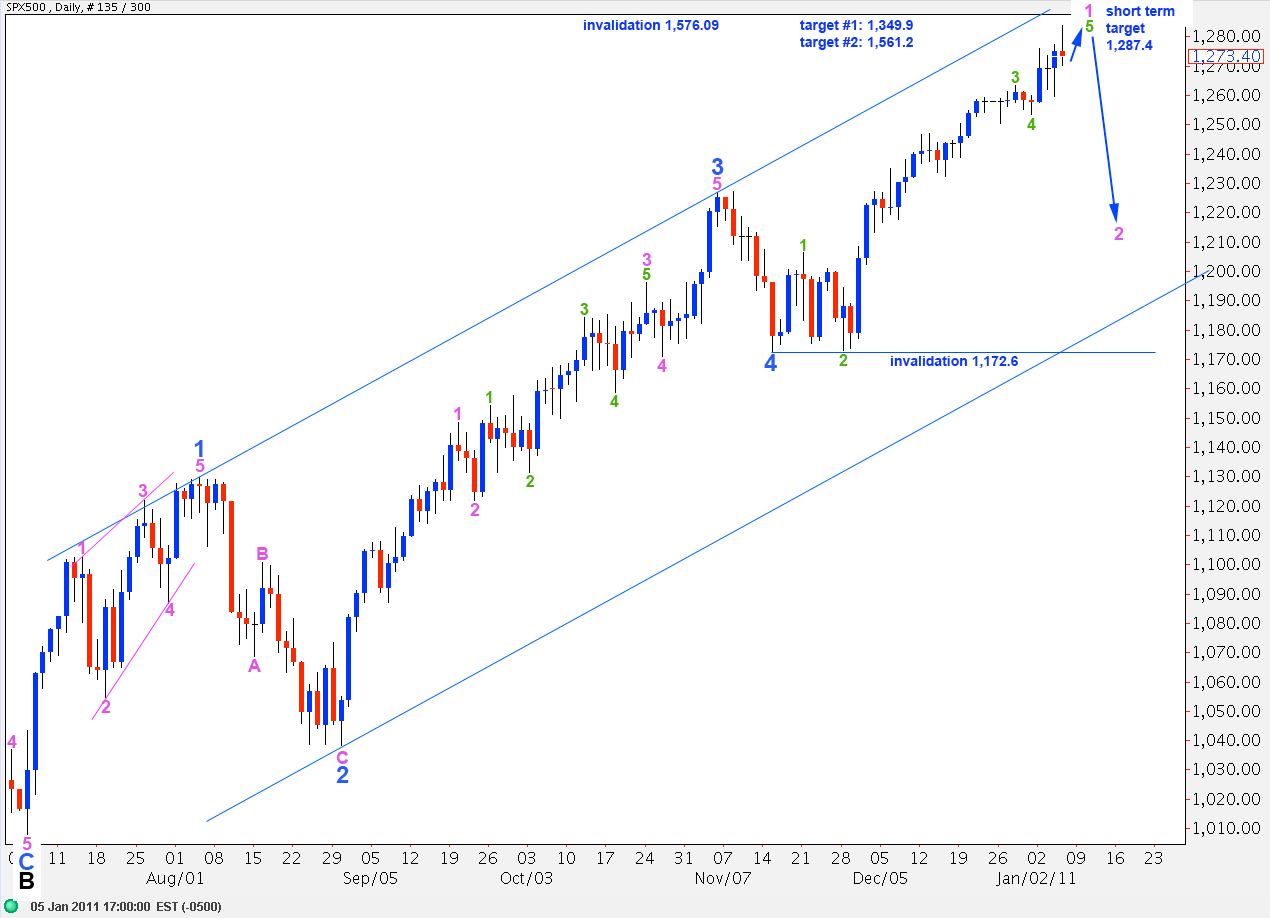
I will present this daily wave count with two degrees of labeling for upward movement since 1,172.6 because the degree of labeling we choose has important implications.
Here upward movement is labeled as only wave 1 pink of wave 5 blue.
At 1,287.4 wave 5 green to end wave 1 pink will reach equality with wave 1 green. Wave 3 green was just 1.3 points longer than 2.618 the length of wave 1 green.
When we have a satisfactory five wave structure upward from the low labeled 4 green at 1,253.4 then we should expect a trend change at least at minute (pink) degree.
Movement below 1,253.4 will provide confirmation of a trend change at minute degree. At that stage we may expect the S&P to move lower for at least another couple of weeks.
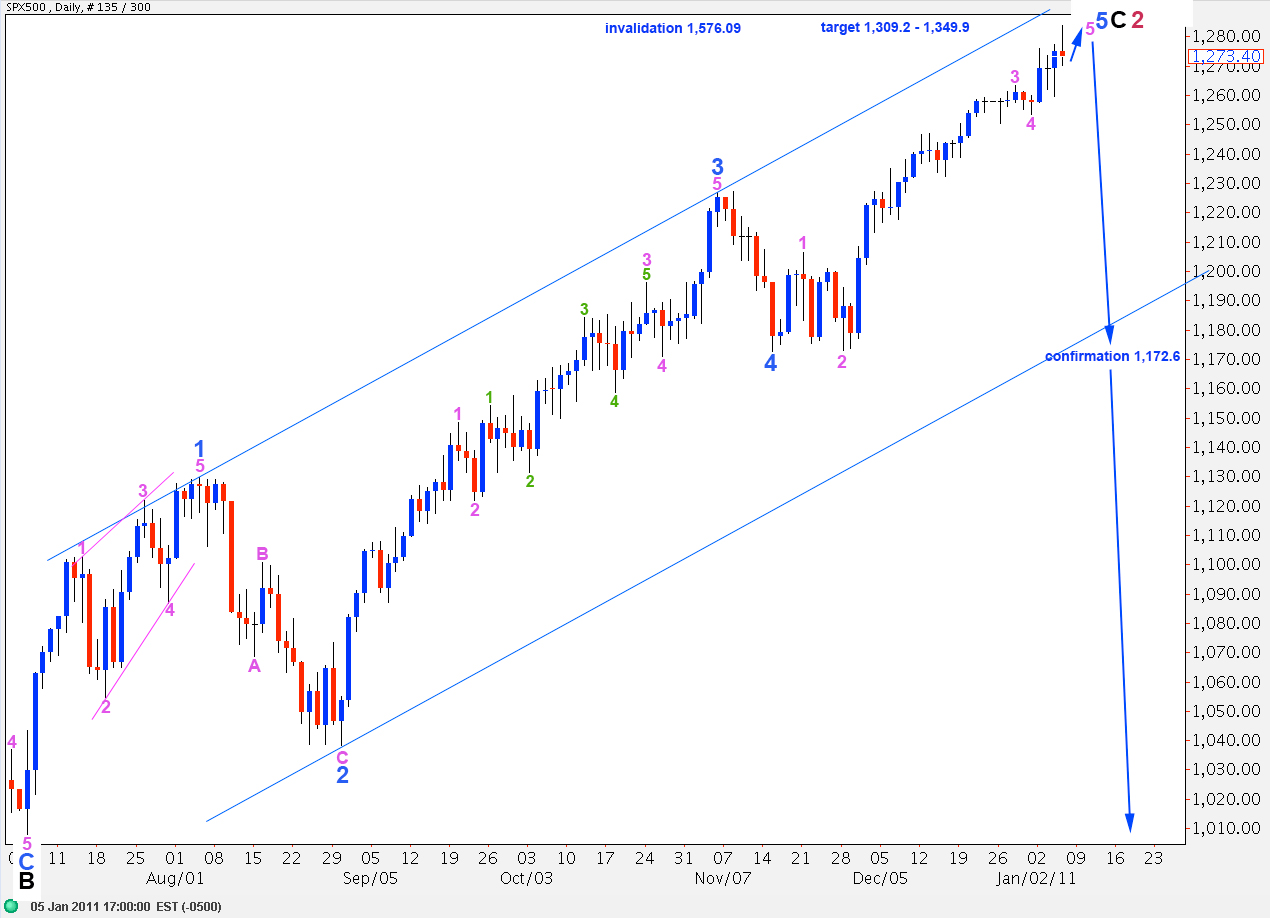
This wave count is the same as the first daily count with the only difference being that the degree of labeling of upward movement, since the end of wave 4 blue at 1,172.6, is here moved up one degree.
The important implication is that we may be nearing the end of primary wave 2 and the long awaited primary wave 3 may be about to start.
At 1,309.2 wave 5 green will reach 0.618 the length of wave 3 green. At 1,349.9 wave C black will reach 0.618 the length of wave A black. Wave 5 blue would have no fibonacci ratio to either 1 or 3 blue, however.
Movement below 1,172.6 would provide confirmation of primary wave 3 being underway. We no longer need to wait for 1,129.9 to be breached for this.
For both interpretations of this daily wave count price may not move above 1,576.09 as primary wave 2 may not move beyond the start of primary wave 1.
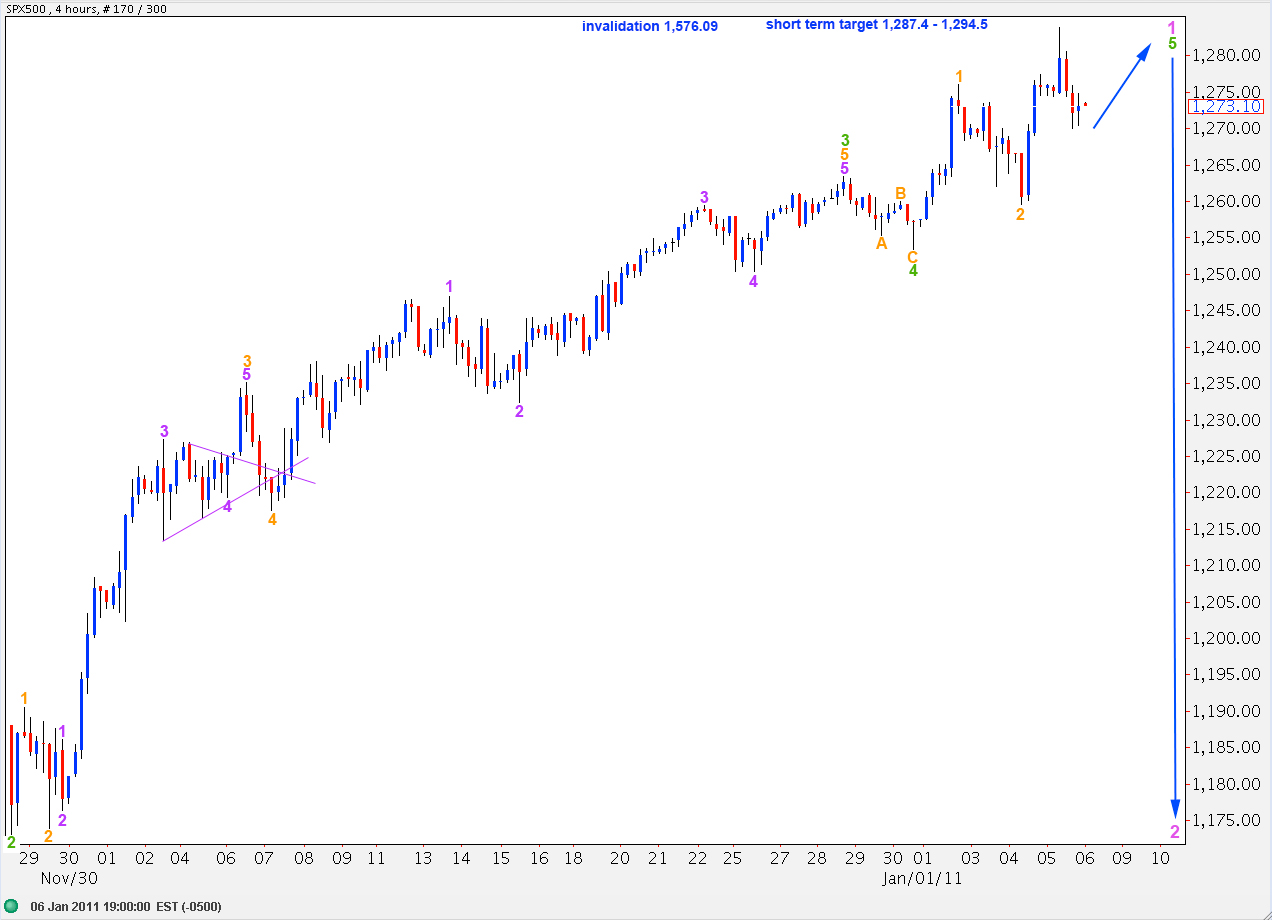
This 4 hourly chart shows all of wave 3 green within wave 1 pink. Or if labeling here was moved up one degree it shows all of wave 3 pink of wave 5 blue.
Ratios within wave 3 green are: wave 3 orange has no fibonacci ratio to wave 1 orange but wave 5 orange is exactly 2.618 the length of wave 1 orange.
Ratios within wave 3 orange are: wave 3 purple is 7 points short of 4.236 the length of wave 1 purple and wave 5 purple is just 2 points longer than equality with wave 1 purple.
Ratios within wave 5 orange are: wave 3 purple is 2.3 points short of equality with wave 1 purple and wave 5 purple is just 1.8 points short of 0.382 the length of wave 1 purple.
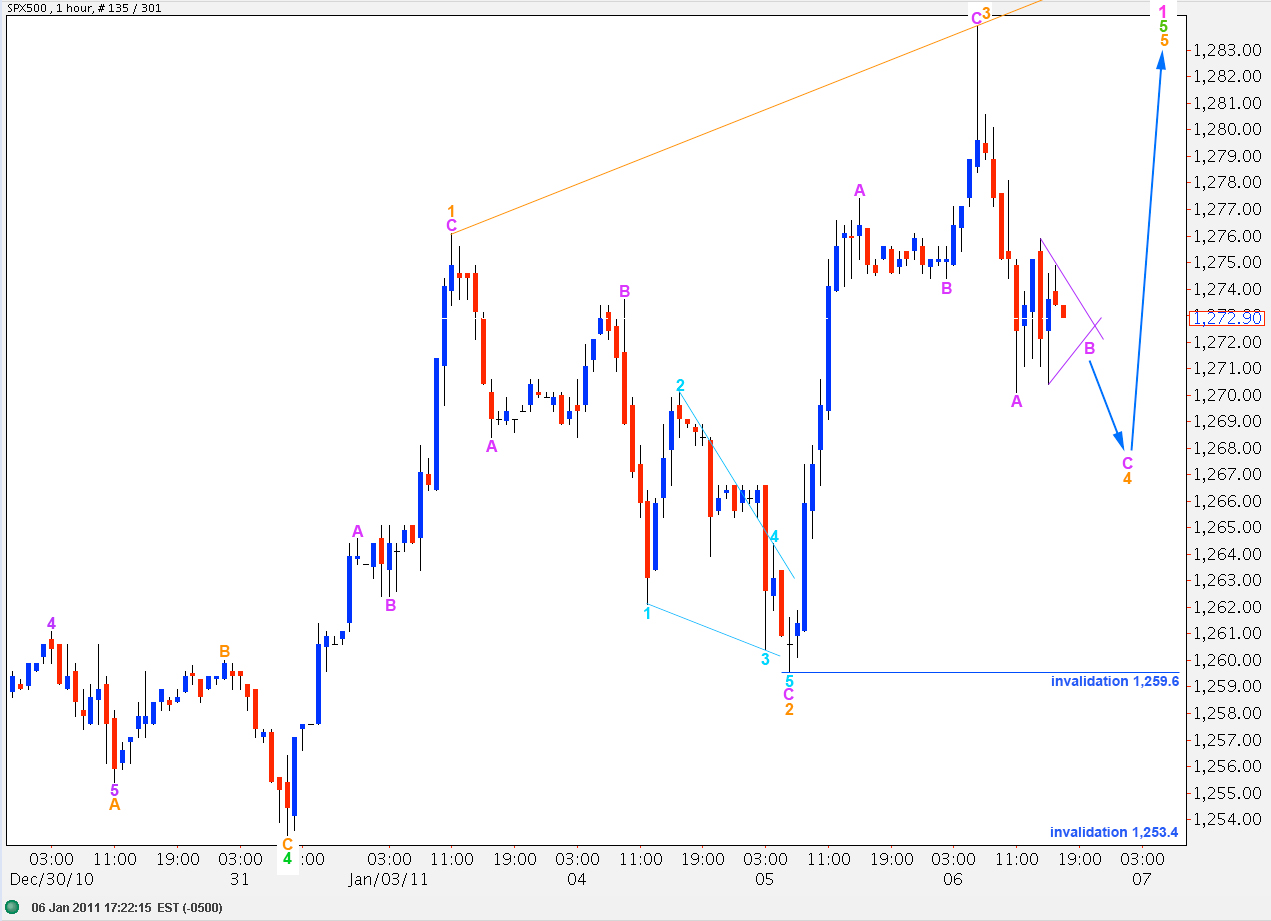
This hourly chart shows wave 5 green, the terminal wave of wave 1 pink.
This structure may be an ending expanding diagonal.
Wave 2 orange was a 73% correction of wave 1 orange. Wave 3 orange was slightly longer than wave 1 orange. Therefore, this structure is most likely to be expanding (although third waves of contracting diagonals are sometimes still the longest).
Therefore, we may expect that a little further downward movement to end wave 4 orange is most likely. At 1,267.4 wave 4 orange will reach equality with wave 2 orange.
Wave 4 orange may not end beyond the end of wave 2 orange. Therefore, this structure is invalidated with movement below 1,259.6.
If price moves below 1,253.4 then we may expect that a trend change has occurred, at least one at minute (pink) degree and possibly one at primary degree.