Elliott Wave chart analysis for the SPX500 for 5th January, 2011. Please click on the charts below to enlarge.
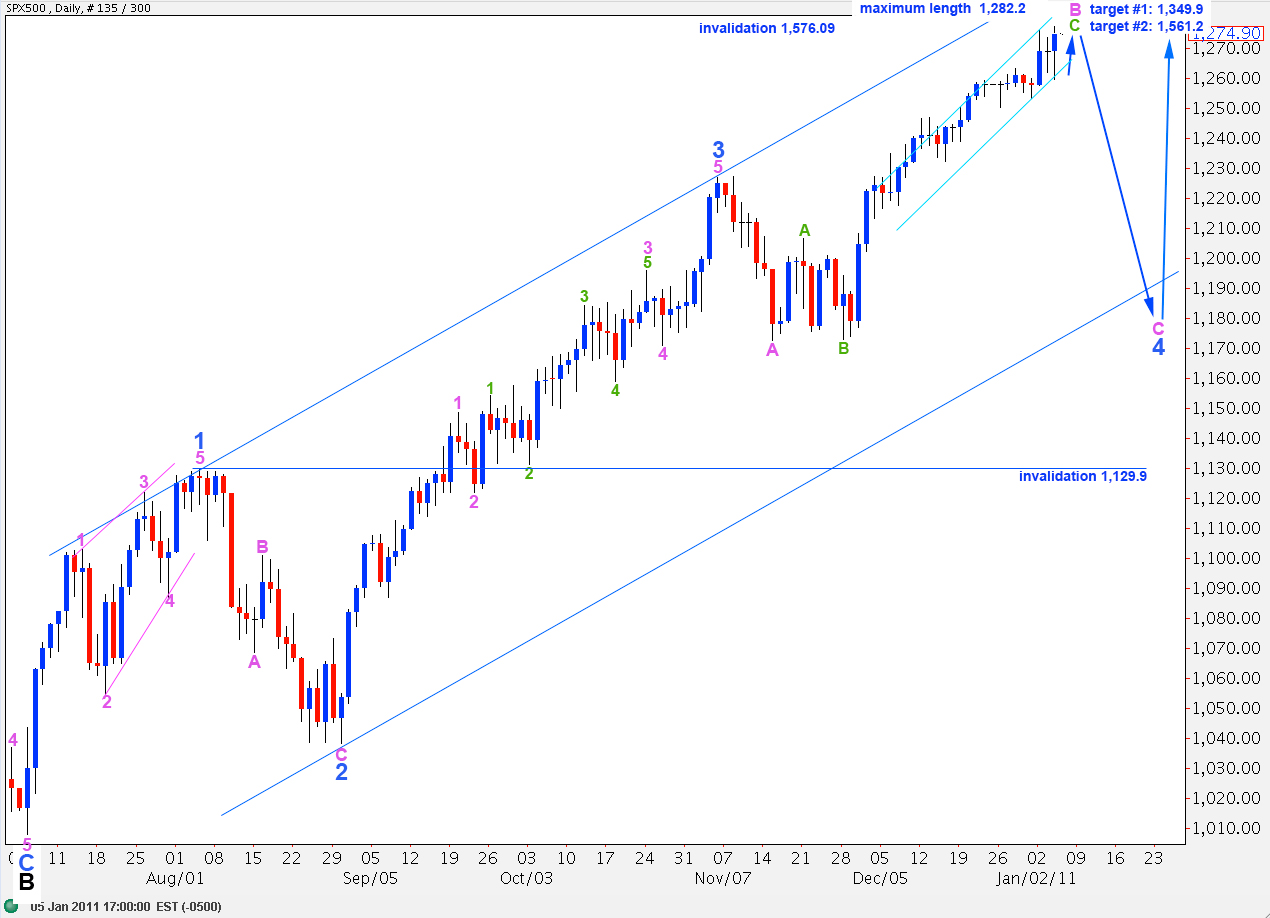
Further upward movement has made this interpretation of an expanded flat correction for wave 4 blue look fairly unlikely. However, it remains technically possible. Until it is invalidated we should continue to consider it. I expect it may be invalidated fairly soon. At that stage we shall use our alternate daily wave count.
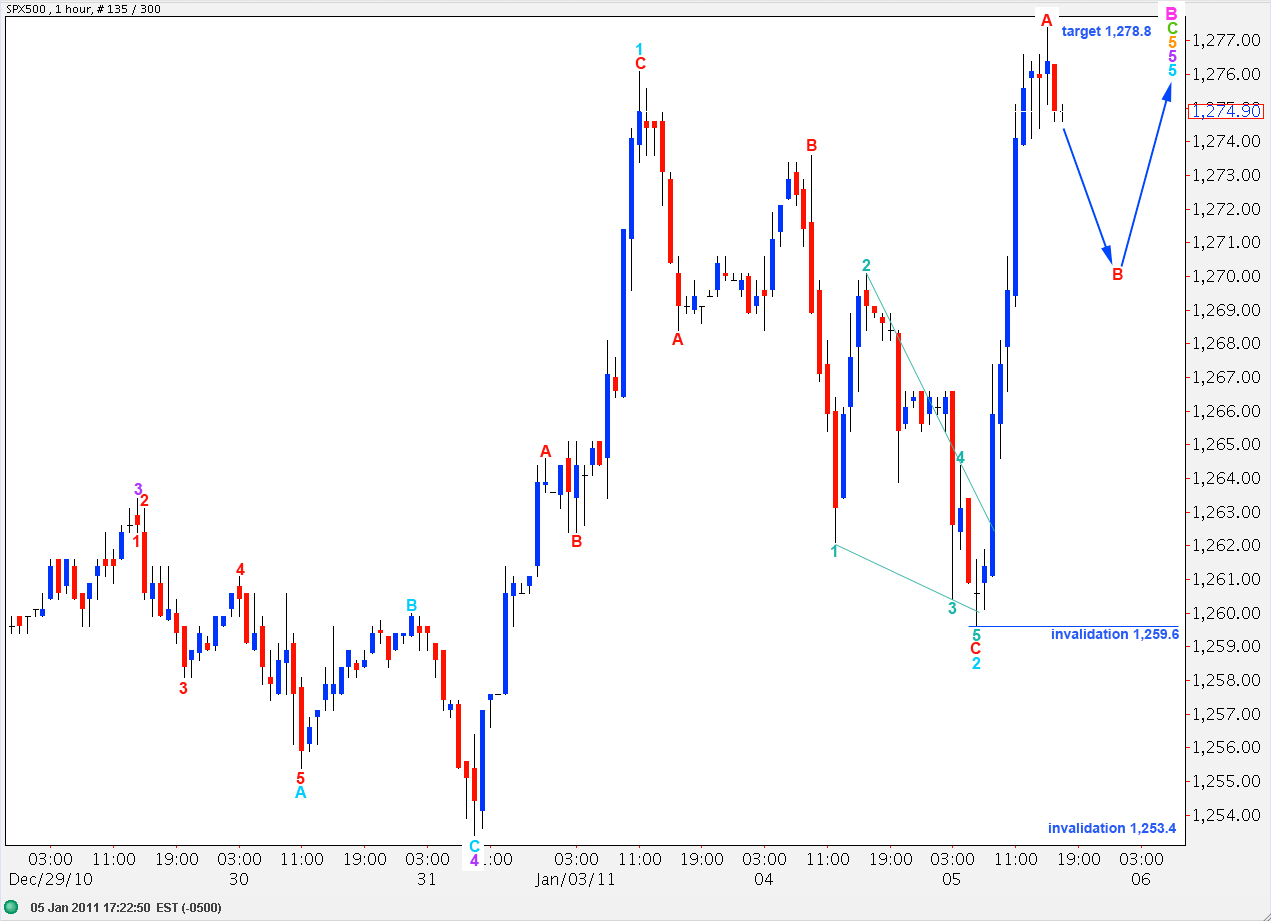
With this very long upward movement, with many subdivisions within it, there are several valid wave counts. Movement below 1,259.6 at this stage will be an initial indication that the trend has changed. Movement below 1,253.4 will provide reasonable confirmation of a trend change because at that point several other possibilities allowing further upwards movement would be eliminated. Therefore, this is still an important validation point for us.
Upward movement has invalidated the alternate hourly wave count and confirmed the main. We have only one wave count for the hourly chart today which expects further upward movement. The hourly wave count for the main and alternate daily counts is pretty much the same, only the degree of labeling differs.
Downward movement below 1,262.1 initially gave an indication that we may have had a trend change. However, movement above 1,276.1 has eliminated that possibility.
This downward movement looks like a larger fractal of wave 4 purple. I have labeled it here as wave 2 aqua of wave 5 purple. Within it wave C red is 1.5 points short of 1.618 the length of wave A red.
Upward movement to follow has a strong impulsive wave count when viewed on a 15 minute chart. Therefore, this may be only wave A red of wave 3 aqua zigzag.
If this wave count is correct we should not see price movement below 1,259.6 as wave B red may not move beyond the start of wave A red.
If this wave count is invalidated by downward movement then we should wait for movement below 1,253.4 to confirm a trend change.
Alternate Daily Wave Count.
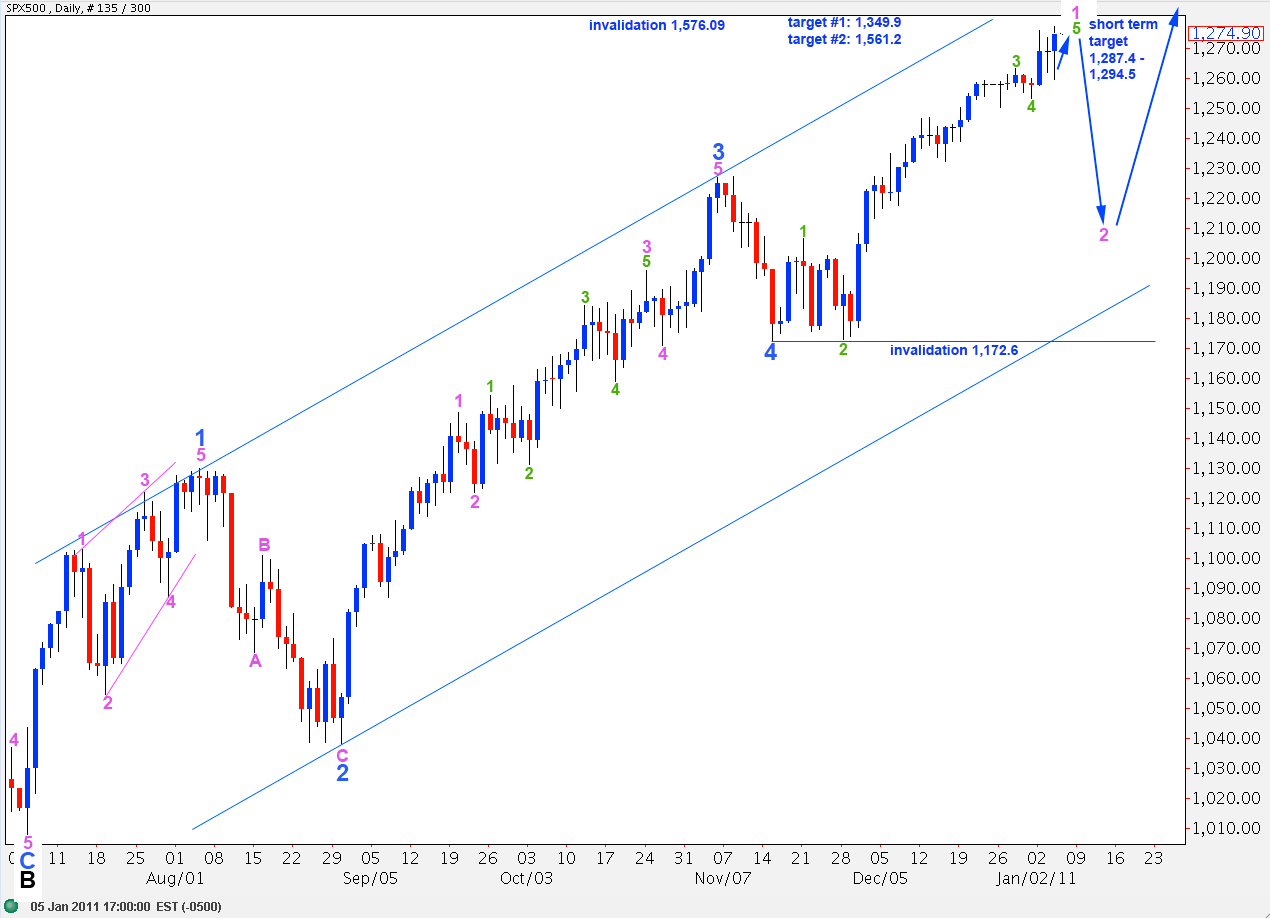
Further upward movement has made this wave count look more likely.
I have moved the labeling for 3 and 4 green today. Wave 3 green is just 1.3 points longer than 2.618 the length of wave 1 green. At 1,287.4 wave 5 green will reach equality with wave 1 green.
With this labeling for wave 5 blue further upward movement is expected. Wave 2 pink may not move beyond the start of wave 1 pink below 1,172.6.
If we move the degree of labeling within wave 5 blue up one degree then we may see the end of intermediate wave C and, therefore, primary wave 2 shortly. If upward movement ends about 1,294.5 then wave 5 blue will reach equality with wave 1 blue.
Therefore, 1,287.4 to 1,294.5 is a reasonable target zone for upward movement to end.


