
Elliott Wave chart analysis for the SPX500 for 3rd January, 2011. Please click on the charts below to enlarge.
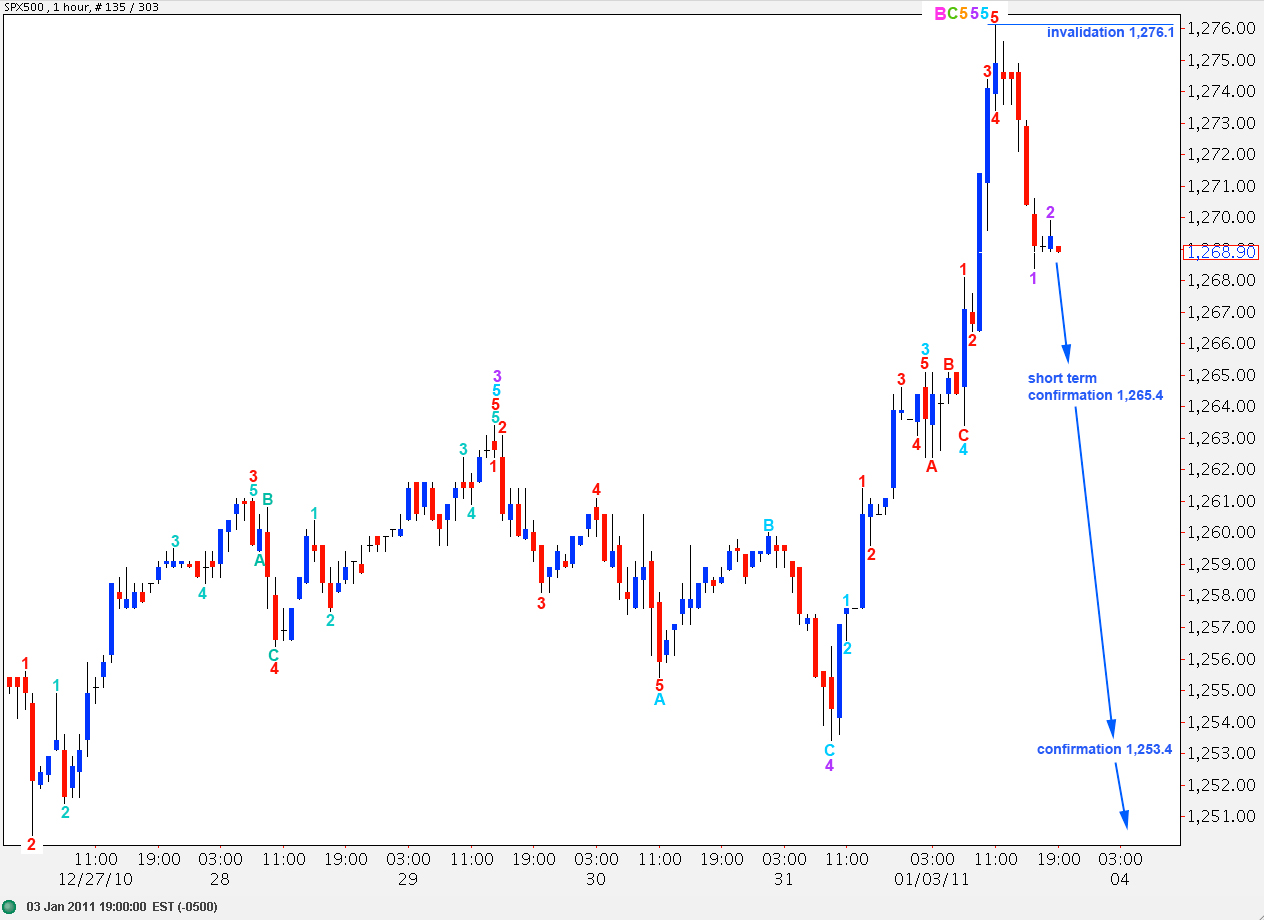
Upward movement above 1,263.4 has invalidated the main hourly wave count and confirmed the alternate.
With further upward movement for wave B pink this wave count is looking less likely. The most likely length of wave B in relation to wave A within an expanded flat correction is up to 138% of A. So far wave B is 189% of A, which is within allowable limits but is less likely.
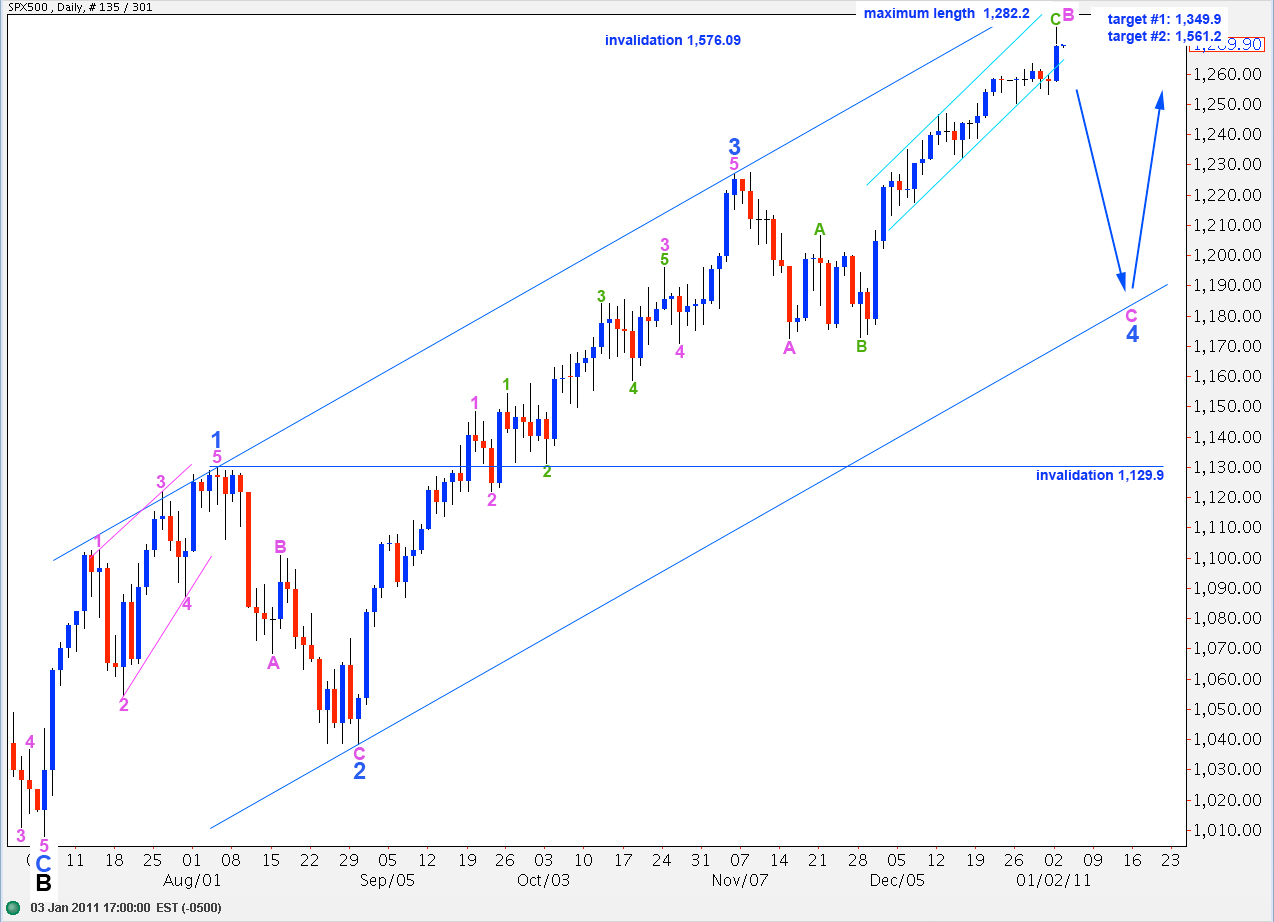
In the long term we may see wave C black end about 1,349.9 where it reaches 0.618 the length of wave A black, or at 1,561.2 where it reaches equality with wave A black. This second target is more likely as equality is the most common relationship between waves A and C within a zigzag.
Upward movement may not move above 1,576.09 as primary wave 2 may not move beyond the end of primary wave 1.
Downward movement for this wave count may not move below 1,129.9 as wave 4 blue may not move into wave 1 blue price territory. If this wave count is invalidated by downward movement then we must consider the possibility that primary wave 2 is over and primary wave 3 is underway.
Main Hourly Wave Count.
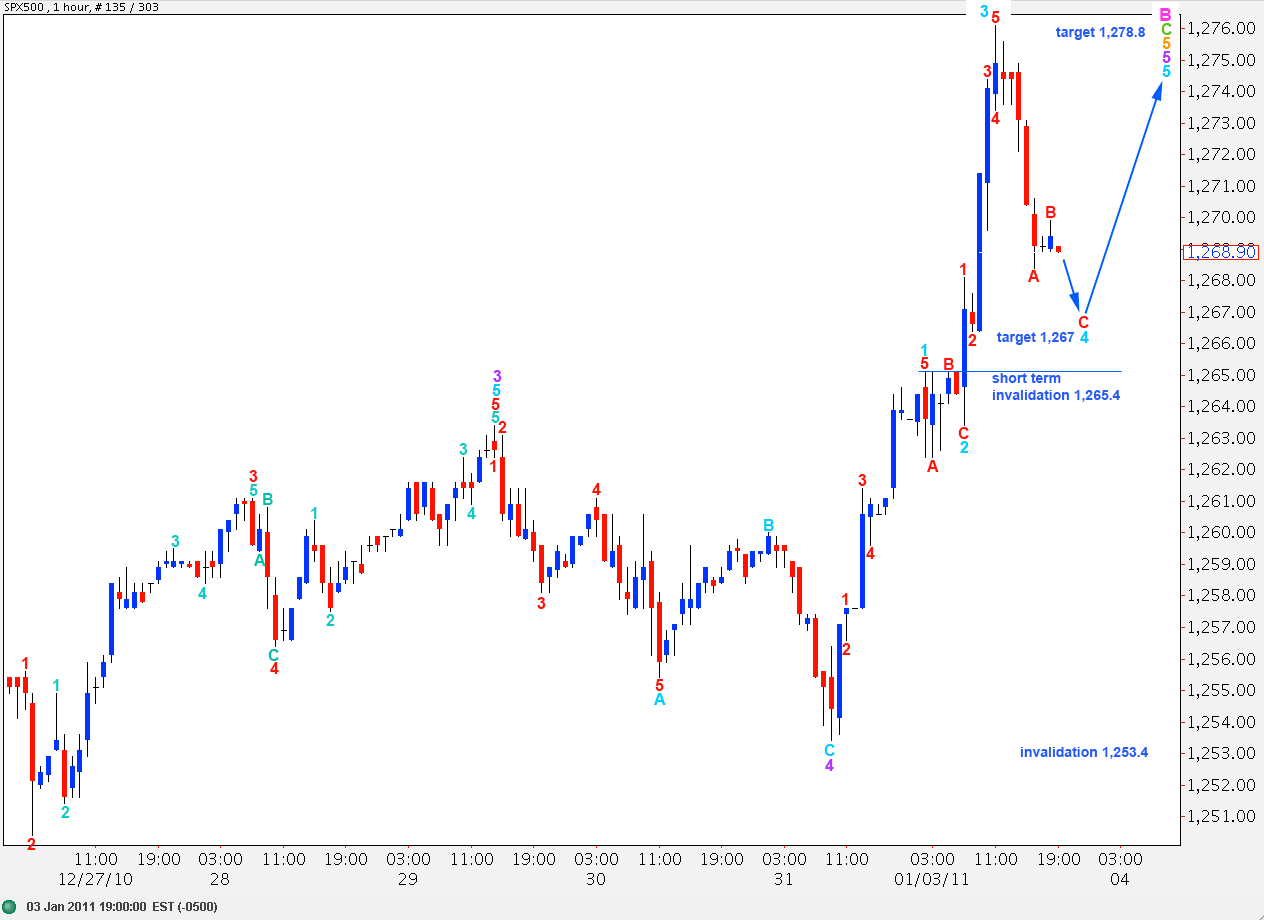
We may have one more push to the upside before this trend may be considered over, at least in the mid term. If price remains above 1,265.4 this wave count will remain valid.
Wave 3 aqua is just 1 point longer than equality with wave 1 aqua.
Ratios within wave 1 aqua are: wave 3 red is 0.6 longer than equality with wave 1 red and wave 5 red is 0.7 longer than equality with wave 3 red.
Ratios within wave 3 aqua are: wave 3 red is 0.4 longer than 1.618 the length of wave 1 red and wave 5 red is 0.2 short of 0.618 the length of wave 1 red.
Within wave 4 aqua wave C red will reach 0.382 the length of wave A red at 1,267. This is our target for downward movement to end.
At 1,278.8 wave 5 orange will reach equality with wave 3 orange.
Alternate Hourly Wave Count.
It is also possible to see recent upward movement as a completed impulse structure.
Ratios within wave 5 purple are: wave 3 aqua has no fibonacci ratio to wave 1 aqua and wave 5 aqua is 1 point longer than 1.618 the length of wave 3 aqua.
Wave B pink would be a 189% correction of wave A pink.
Within wave C green there are no fibonacci ratios within waves at orange degree.
Within wave 5 orange ratios are: wave 3 purple is 2 points longer than equality with wave 1 purple and wave 5 purple is 3.5 points longer than 0.618 the length of wave 3 purple.
Movement above 1,276.1 would invalidate this wave count.
Movement below 1,265.4 would indicate that this wave count would be more likely than the main wave count. Movement below 1,253.4 would confirm this wave count.
Alternate Daily Wave Count.
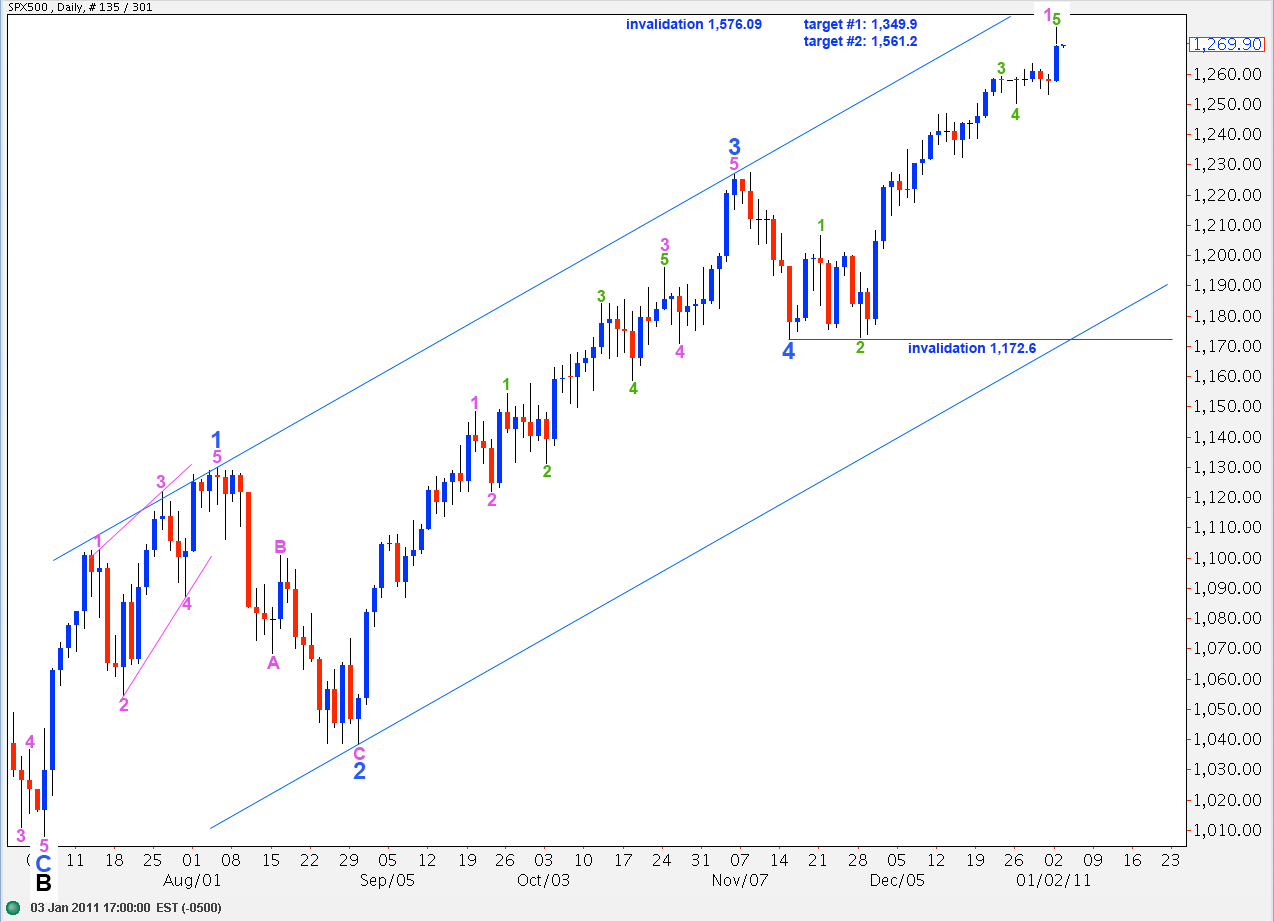
Continuing upward movement makes this wave count seem more and more likely.
If wave 1 pink (or 5 blue) was over at Monday’s high then wave 1 pink (or 5 blue) would have lasted a fibonacci 34 days.
This wave count sees wave 5 blue to end wave C at intermediate (black) degree as unfolding. It may be over, if we move the degree of labeling for wave 5 blue up one degree. Or only the first wave within wave 5 blue may be ending, if this degree of labeling is correct.
If we relabel recent upward movement all up one degree and see an end to wave 5 blue and, therefore, black C and primary wave 2 then waves 3 and 5 blue within C black have some fibonacci ratios to waves 3 and 5 blue within wave A black. Wave 3 blue within intermediate A is 24 points short of 1.618 the length of 3 blue within intermediate C and wave 5 blue within intermediate A is almost (less than 1 point) 1.618 the length of wave 5 blue within intermediate C. Waves 1 blue in both intermediate A and C have no relationship.
However, waves A and C at intermediate degree, importantly, have no fibonacci relationship.