
Elliott Wave chart analysis for the SPX500 for 31st December, 2010. Please click on the charts below to enlarge.
For the short term the S&P has behaved as expected. Price remains above 1,246.6. Therefore, a trend change remains unconfirmed.
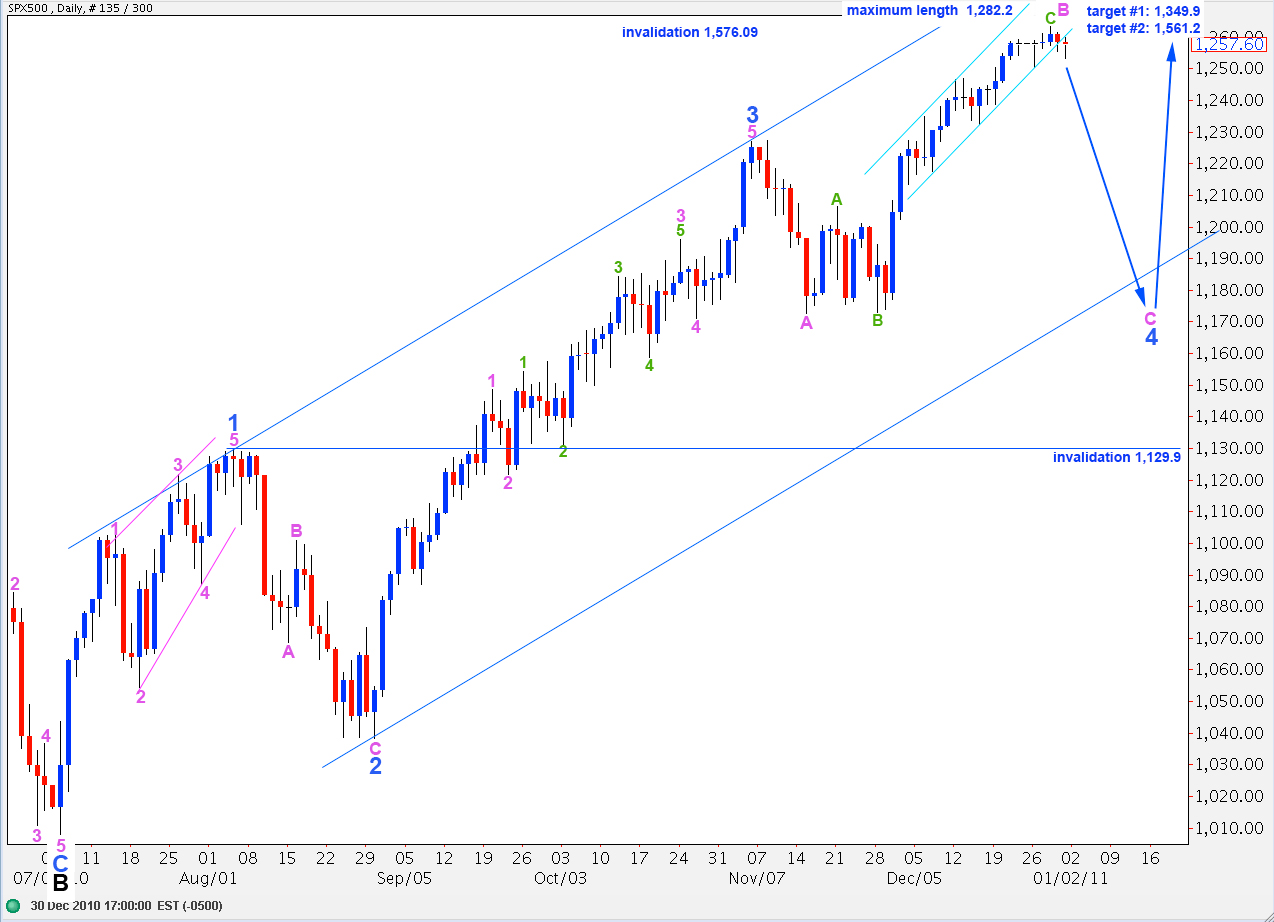
We now have a small daily bar outside the small parallel channel containing recent upward movement. This may be our first indication of a trend change or it may be a larger correction before price turns back up again.
In the long term we may see wave C black end about 1,349.9 where it reaches 0.618 the length of wave A black, or at 1,561.2 where it reaches equality with wave A black. This second target is more likely as equality is the most common relationship between waves A and C within a zigzag.
Upward movement may not move above 1,576.09 as primary wave 2 may not move beyond the end of primary wave 1.
Downward movement for this wave count may not move below 1,129.9 as wave 4 blue may not move into wave 1 blue price territory. If this wave count is invalidated by downward movement then we must consider the possibility that primary wave 2 is over and primary wave 3 is underway.
Main Hourly Wave Count.

Wave 4 purple of this leading diagonal moved a little higher but remained below the end of wave 2 of the diagonal. Thereafter, price turned downward to end just 0.5 below the target.
We can now see a clear five wave structure down on the hourly chart. This should be followed by a correction, most likely a three wave structure, to the upside. The target for this to end lies between 1,259.8 to 1,260.
When this second wave correction is over the next wave down may be the movement which provides us with clarity. If the third wave moves below 1,246.6 then this wave count will be confirmed and we may expect the trend to remain down at least for a couple of weeks.
If price remains above 1,246.6 then the alternate wave count below will continue to be valid.
Alternate Hourly Wave Count.
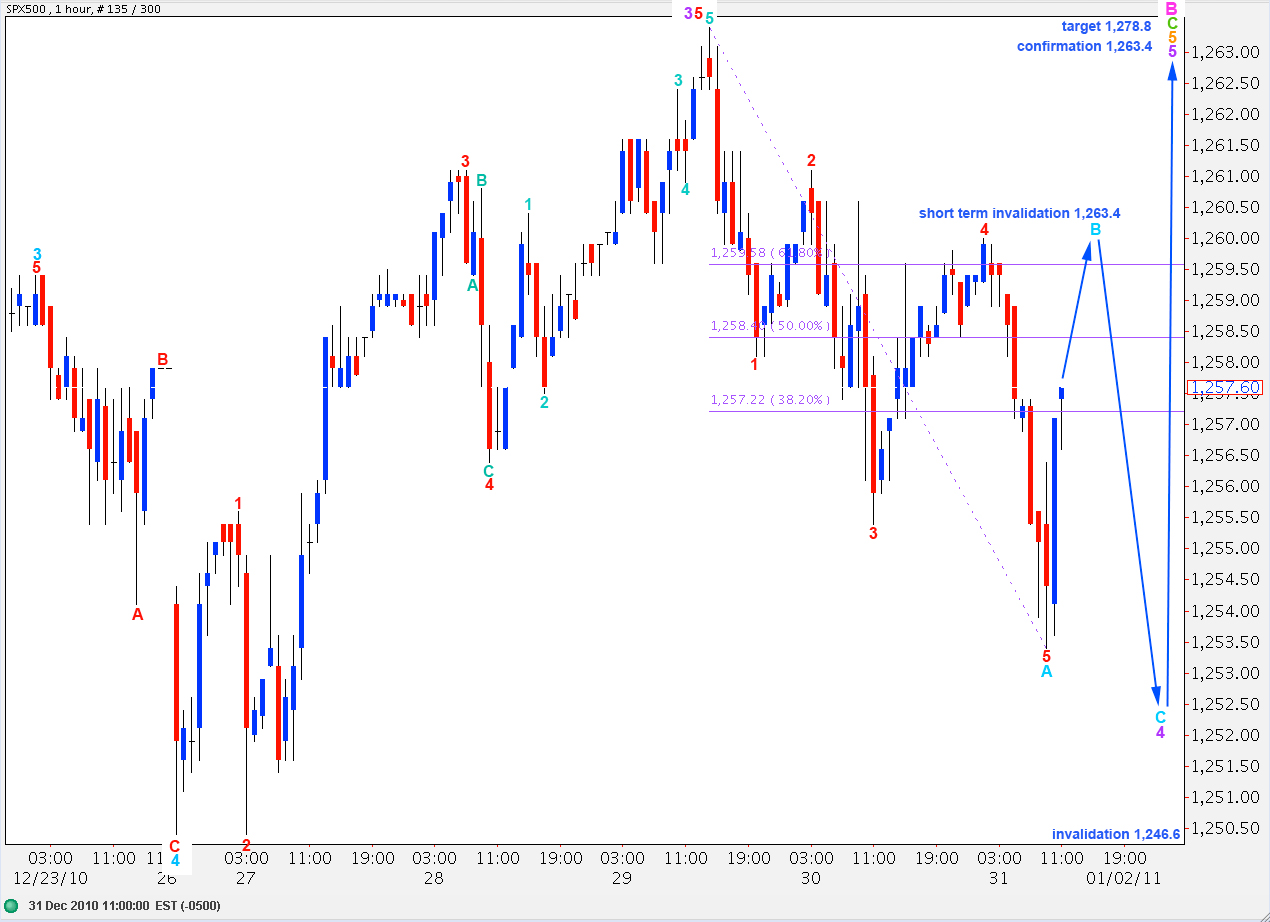
Movement for the short term is exactly the same for both wave counts. This alternate wave count sees downward movement as wave A of a fourth wave correction.
Upward movement for wave B of this correction may not move above 1,263.4 as B may not move beyond the start of A.
Wave C to the downside to end wave 4 purple may not move into wave 1 purple price territory. This wave count is, therefore, invalidated with movement below 1,246.6.
Alternate Daily Wave Count.
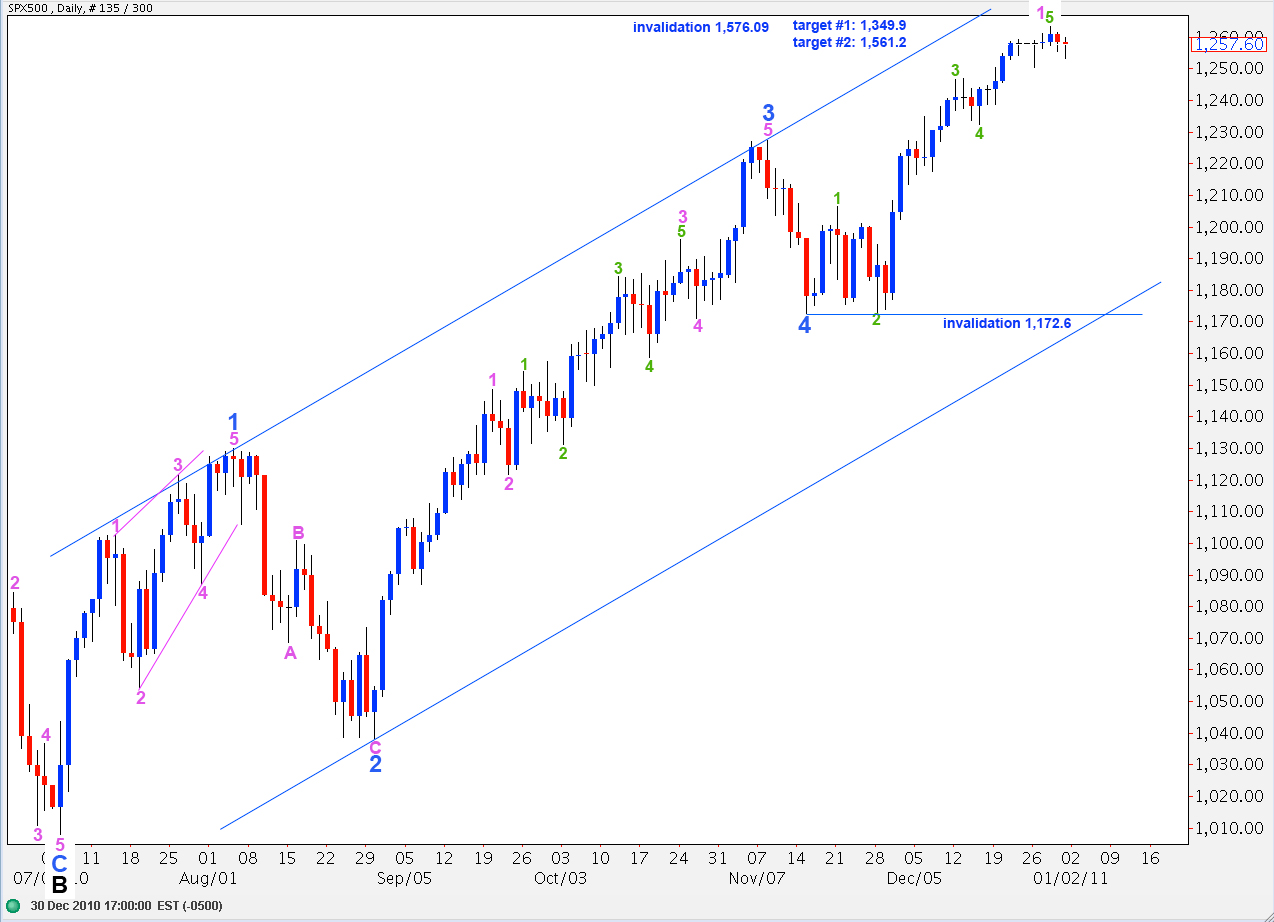
This wave count remains valid. If we see a new high above 1,263.4 then the probability that this wave count is correct will increase significantly.
This wave count sees wave 5 blue to end wave C at intermediate (black) degree as unfolding. It may be over, if we move the degree of labeling for wave 5 blue up one degree. Or only the first wave within wave 5 blue may be ending, if this degree of labeling is correct.