
Elliott Wave chart analysis for the SPX500 for 30th December, 2010. Please click on the charts below to enlarge.
The S&P has moved lower but we still do not have confirmation of a trend change at minute degree (or higher).
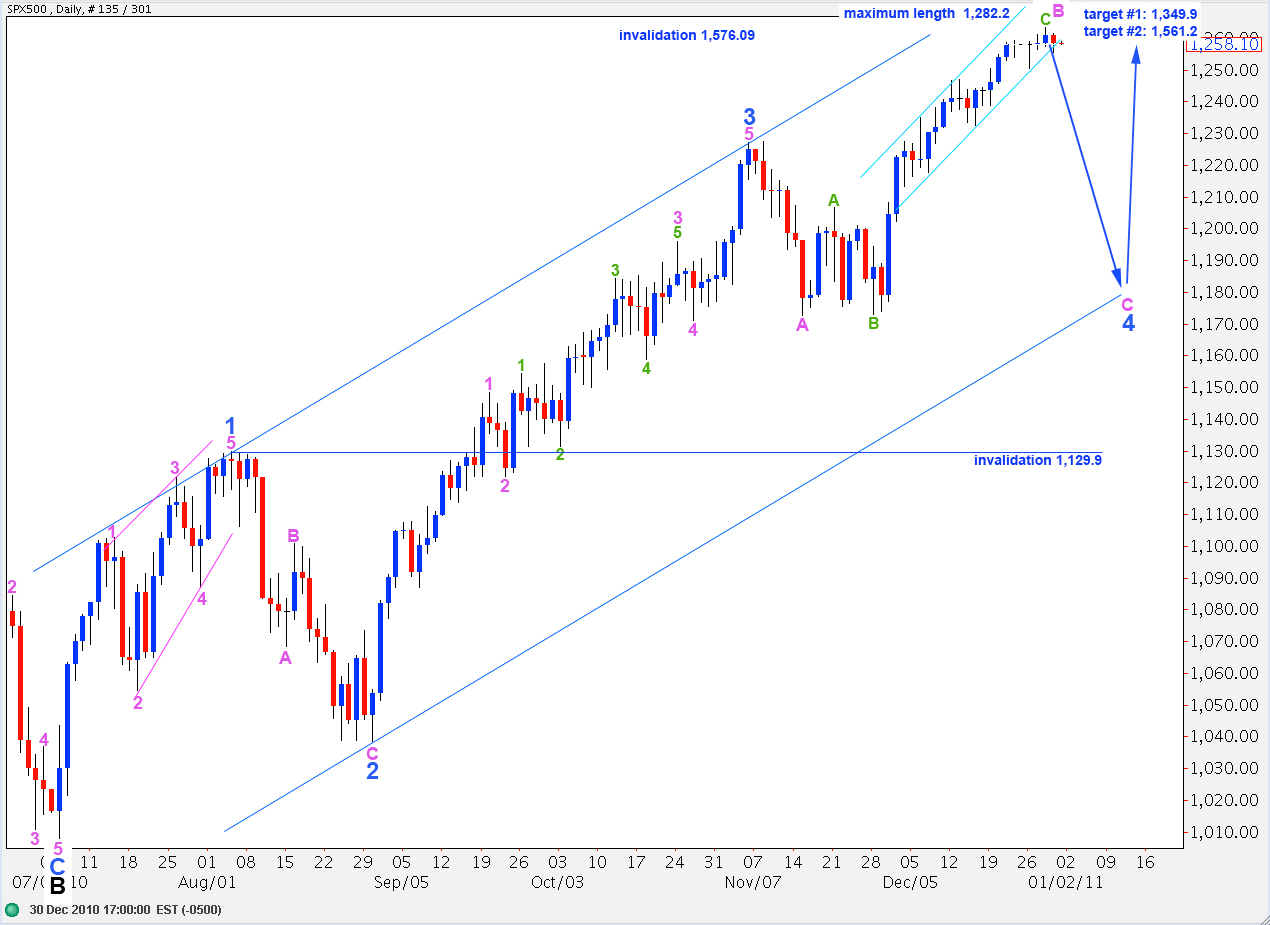
We have a little movement outside the lower edge of the small light blue parallel channel drawn here on the daily chart containing recent upward movement. Movement outside of this channel is not confirmation of a trend change, but it is an early indicator.
In the long term we may see wave C black end about 1,349.9 where it reaches 0.618 the length of wave A black, or at 1,561.2 where it reaches equality with wave A black. This second target is more likely as equality is the most common relationship between waves A and C within a zigzag.
Upward movement may not move above 1,576.09 as primary wave 2 may not move beyond the end of primary wave 1.
Downward movement for this wave count may not move below 1,129.9 as wave 4 blue may not move into wave 1 blue price territory. If this wave count is invalidated by downward movement then we must consider the possibility that primary wave 2 is over and primary wave 3 is underway.
While price remains above 1,246.6 we will still have two hourly wave counts.
Main Hourly Wave Count.
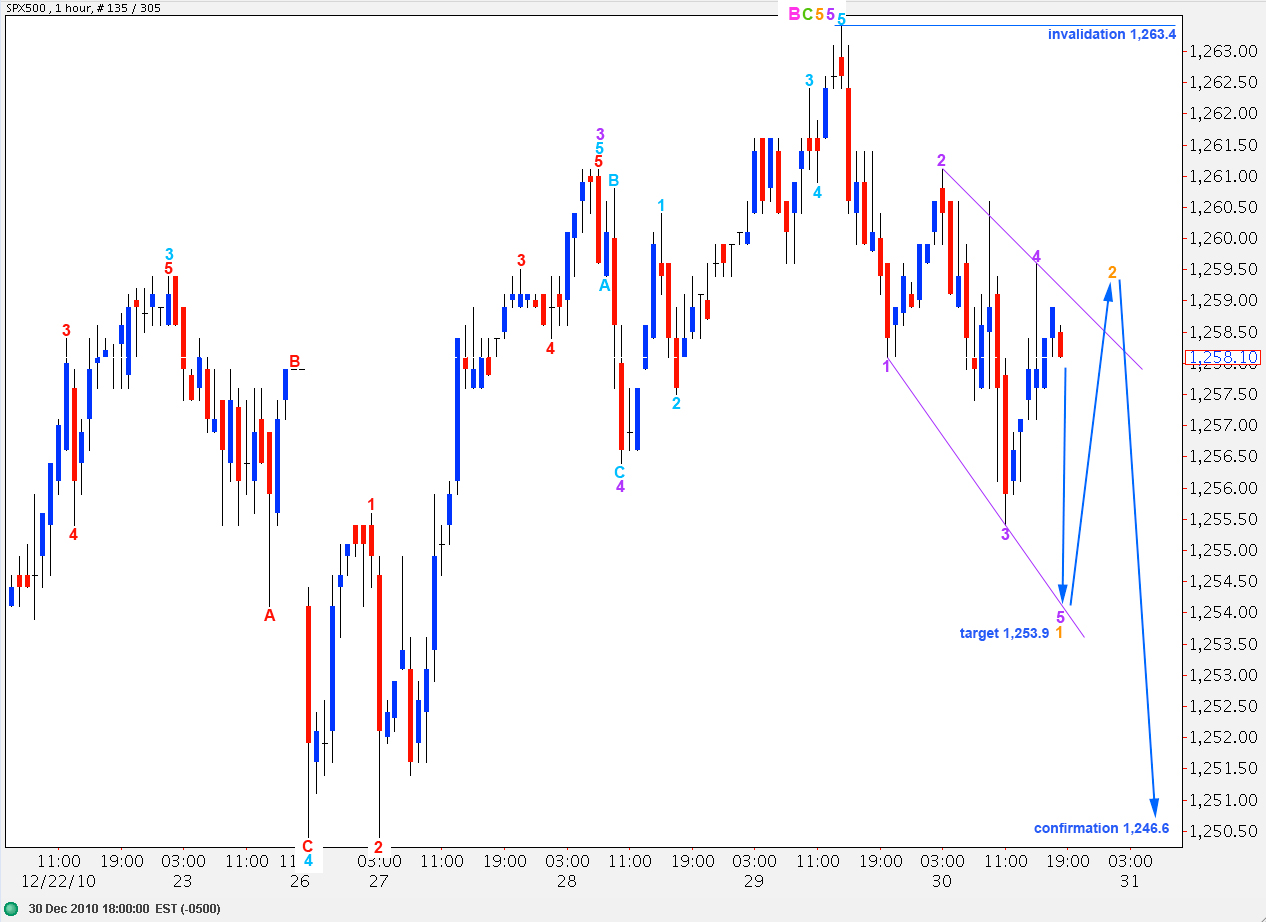
Downward movement may be a leading expanding diagonal unfolding. Wave 5 of the diagonal should be longer than wave 3 purple. Equality with wave 3 purple will be achieved at 1,253.9. We should expect a little further downward movement to at least this point, and likely a little lower. At that stage, we shall have a five wave down structure and thereafter be followed by a three up.
Wave 2 orange may not move beyond the start of wave 1 orange. Therefore, this wave count is invalidated with movement above 1,263.4.
If this wave count is invalidated we should use the alternate below.
Alternate Hourly Wave Count.
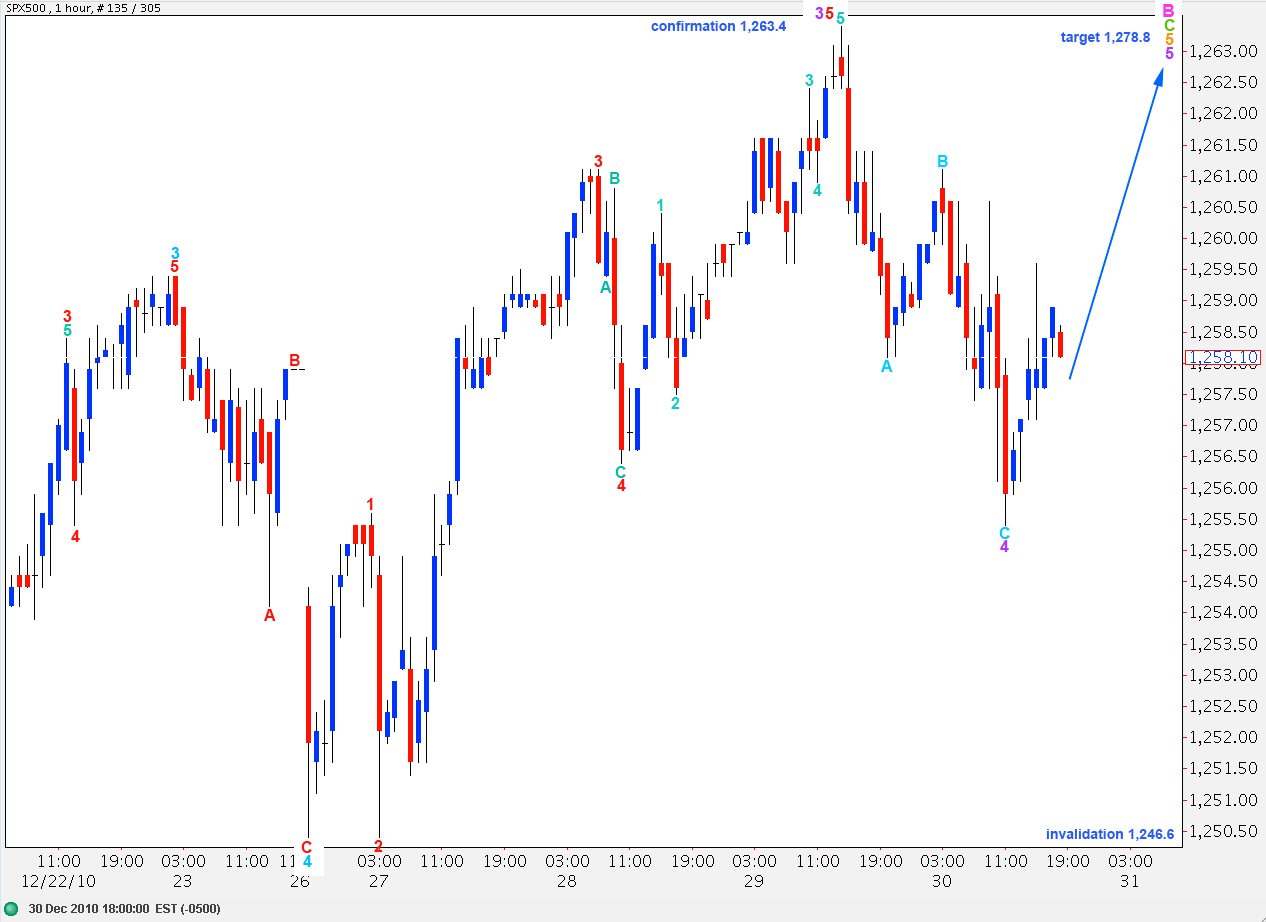
Downward movement may also be a leading diagonal for wave A aqua of wave 4 purple, or it may be an A-B-C for wave 4 purple complete.
This wave count will be confirmed with movement above 1,263.4 as that is where the main wave count will be invalidated.
This wave count would be invalidated with movement below 1,246.6. At that stage we would see our main wave count expecting significant further downward movement.
Alternate Daily Wave Count.
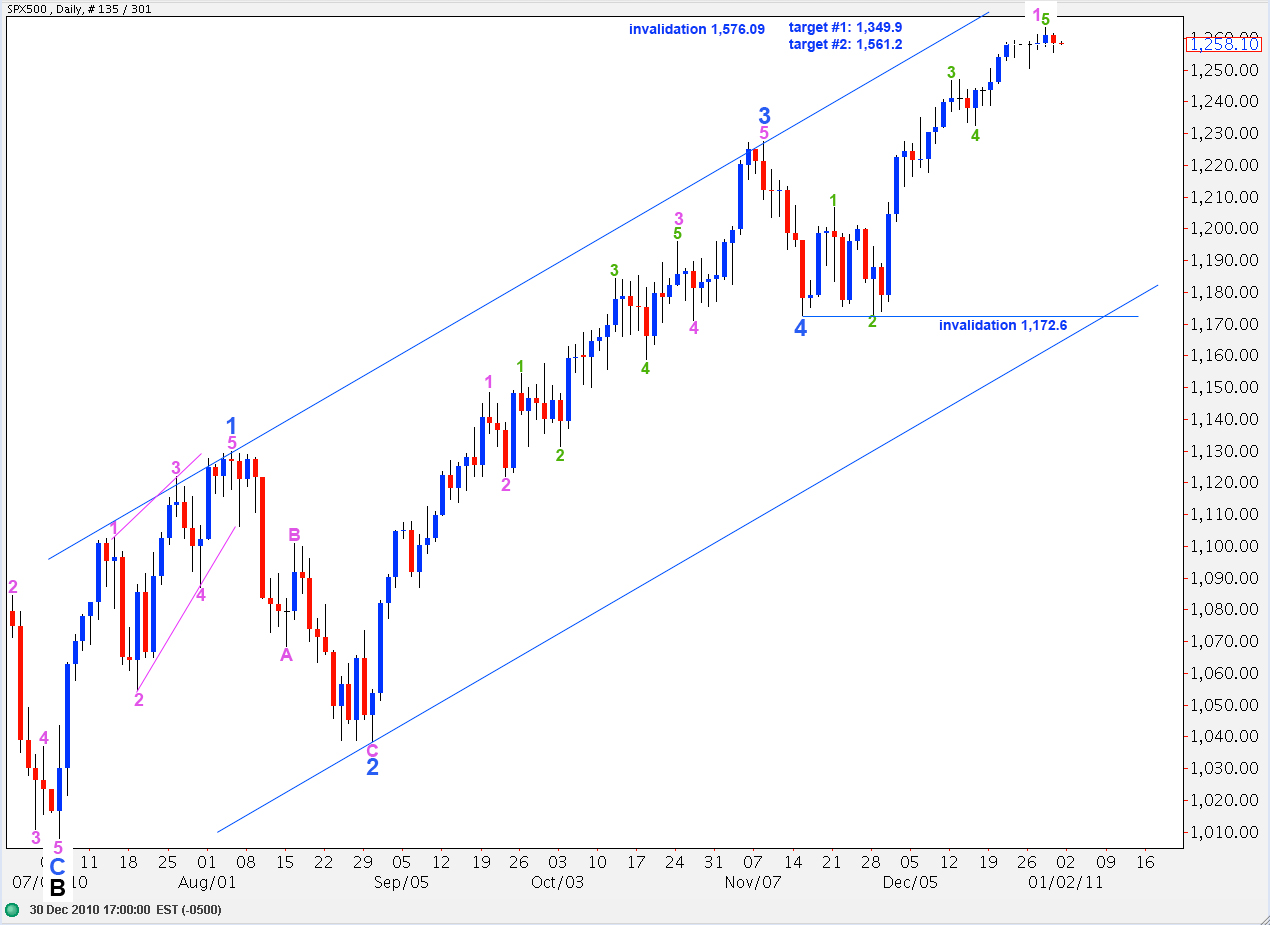
This wave count remains valid. If we see a new high above 1,263.4 then the probability that this wave count is correct will increase significantly.
This wave count sees wave 5 blue to end wave C at intermediate (black) degree as unfolding. It may be over, if we move the degree of labeling for wave 5 blue up one degree. Or only the first wave within wave 5 blue may be ending, if this degree of labeling is correct.