
Elliott Wave chart analysis for the SPX500 for 29th December, 2010. Please click on the charts below to enlarge.
The S&P has behaved exactly as expected according to our main wave count for the last week. We are at a critical juncture today; we may have just seen a trend change at minute degree (at least).
However, we should assume that the trend remains up until proven otherwise. Trying to pick tops is a sure way to kill your account. Exercising a little patience at this stage may be amply rewarded and may avoid unnecessary losses. (Anyway, we should all be enjoying the holiday season and trading should not be at the top of our lists of things to do at this time of year.) 🙂
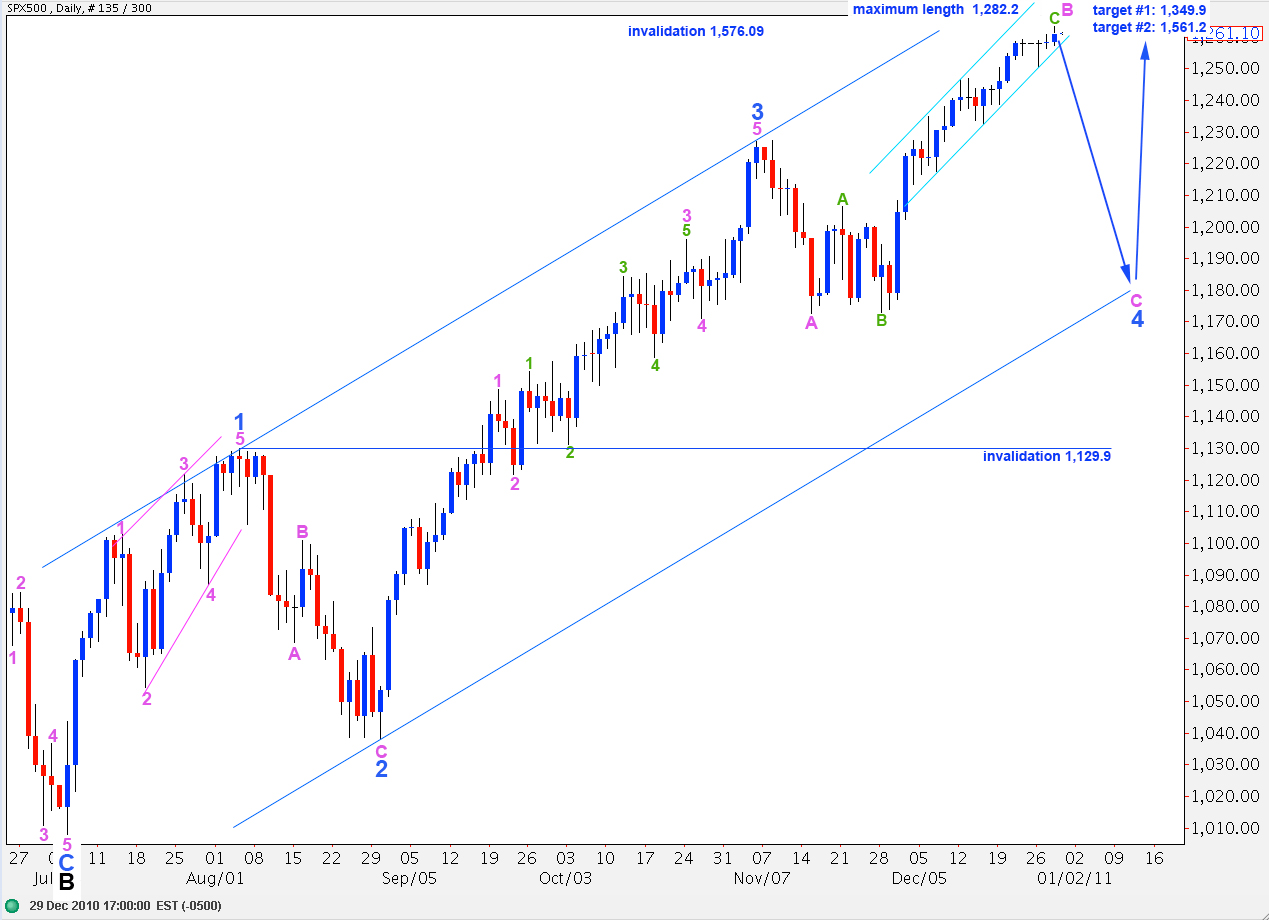
In the long term we may see wave C black end about 1,349.9 where it reaches 0.618 the length of wave A black, or at 1,561.2 where it reaches equality with wave A black. This second target is more likely as equality is the most common relationship between waves A and C within a zigzag.
Upward movement may not move above 1,576.09 as primary wave 2 may not move beyond the end of primary wave 1.
Downward movement for this wave count may not move below 1,129.9 as wave 4 blue may not move into wave 1 blue price territory. If this wave count is invalidated by downward movement then we must consider the possibility that primary wave 2 is over and primary wave 3 is underway.
I have drawn a small trend channel around recent upward movement. This is not Elliott’s technique but it may still work well for us. When this small channel is breached to the downside we may have our first indication of a trend change at minute (pink) degree.
It is also possible that this trend change may be at minor degree; we may have just seen the end to wave 3 blue and the start of wave 4 blue. If this is the case then downward movement will be a corrective structure, either a three or a triangle. I will be analysing downward movement carefully with this alternate in mind.
It is possible today to see a complete upward structure for wave C green to end wave B pink. It is also possible to see upward movement as requiring at least one final push before it is over. I, therefore, have two hourly wave counts for you today. We should use invalidation and confirmation points to work with these.
Main Hourly Wave Count.
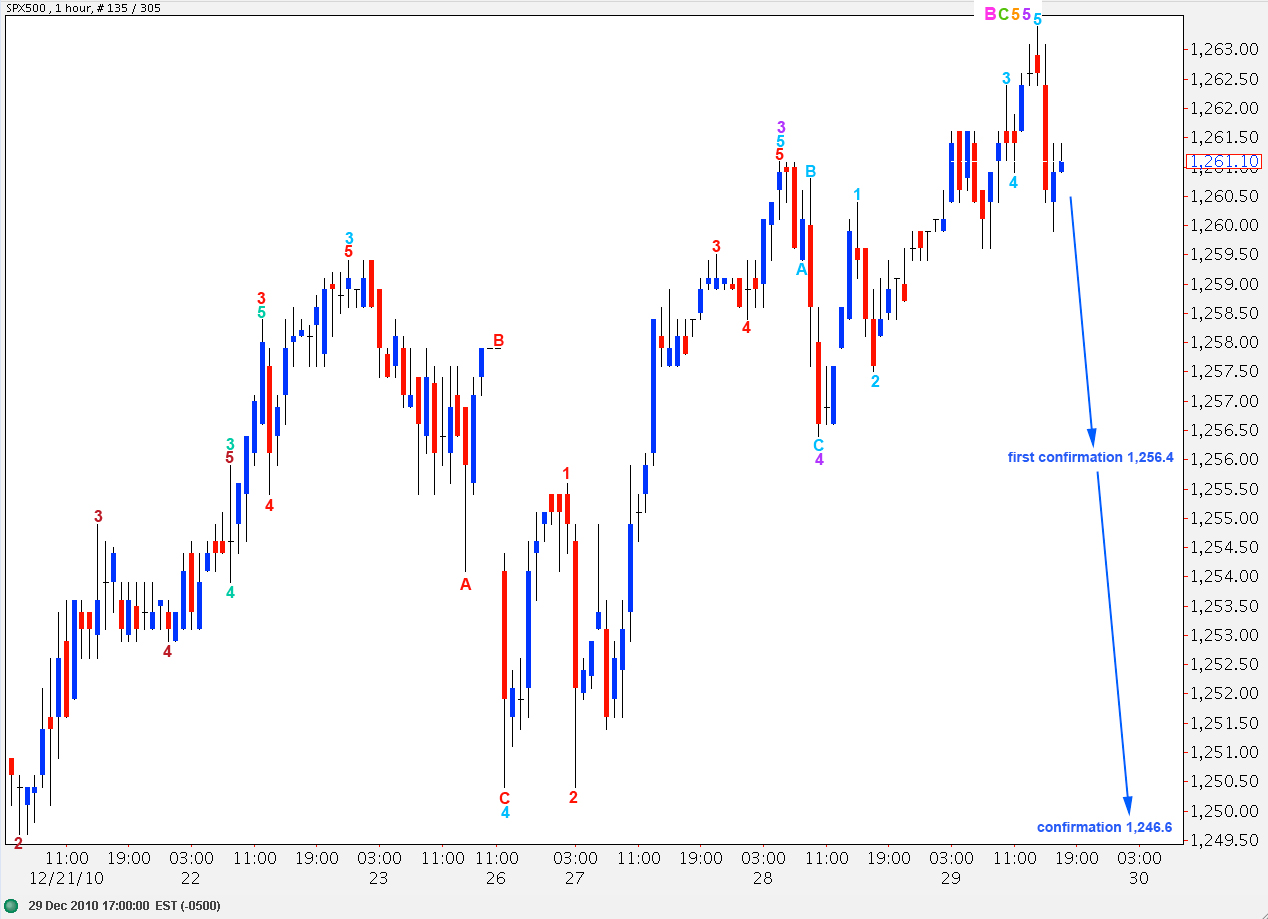
If upward movement is over then we have just seen a trend change at minute degree. Wave C pink should move down to end substantially below the end of wave A pink at 1,172.6. When this trend change is confirmed I will calculate downward targets for you. To do so today would be premature.
Ratios within wave B pink are: wave C green is just 1.29 points longer than 2.618 the length of wave A green.
Ratios within wave C green are: wave 3 orange has no fibonacci ratio to wave 1 orange and wave 5 orange is exactly equal to 2.618 the length of wave 1 orange.
Ratios within wave 5 orange are: wave 3 purple is 0.3 points short of equality with wave 1 purple and wave 5 purple is just 0.2 longer than 0.236 the length of wave 3 purple.
Ratios within wave 5 purple are: wave 3 aqua is 0.9 points longer than equality with wave 1 aqua and wave 5 aqua is exactly 0.618 the length of wave 1 aqua.
If upward movement is over here then there are some very good fibonacci ratios within these waves.
We need to see movement below 1,246.6 to provide final confirmation of this trend change. Until that occurs we must understand that the possibility of new highs remains.
Alternate Hourly Wave Count.
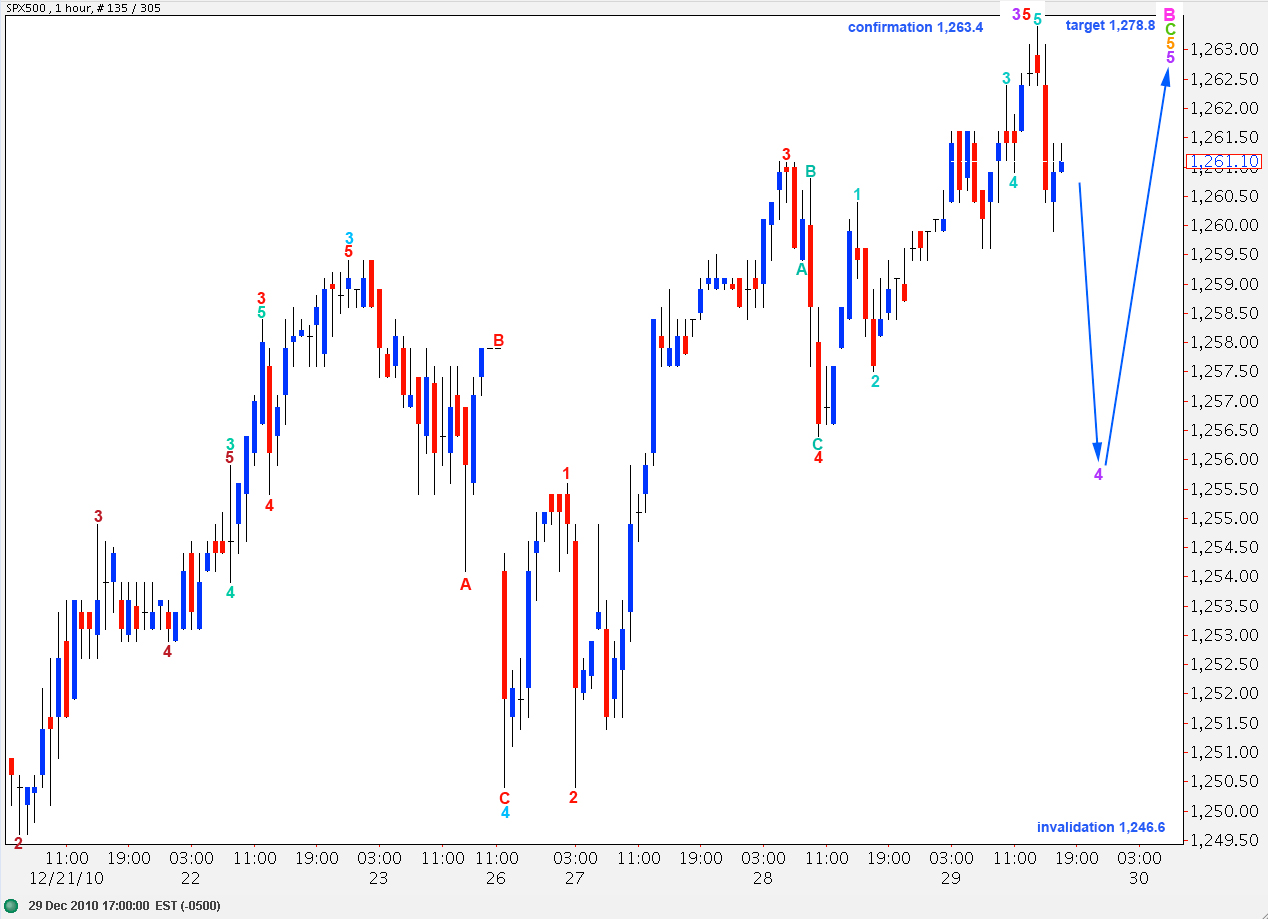
If the main hourly wave count is invalidated by movement above 1,263.4 to a new high then we may expect yet more slow moving upward movement for another week or so.
At 1,278.8 wave 5 orange will reach equality with wave 3 orange.
Alternate Daily Wave Count.
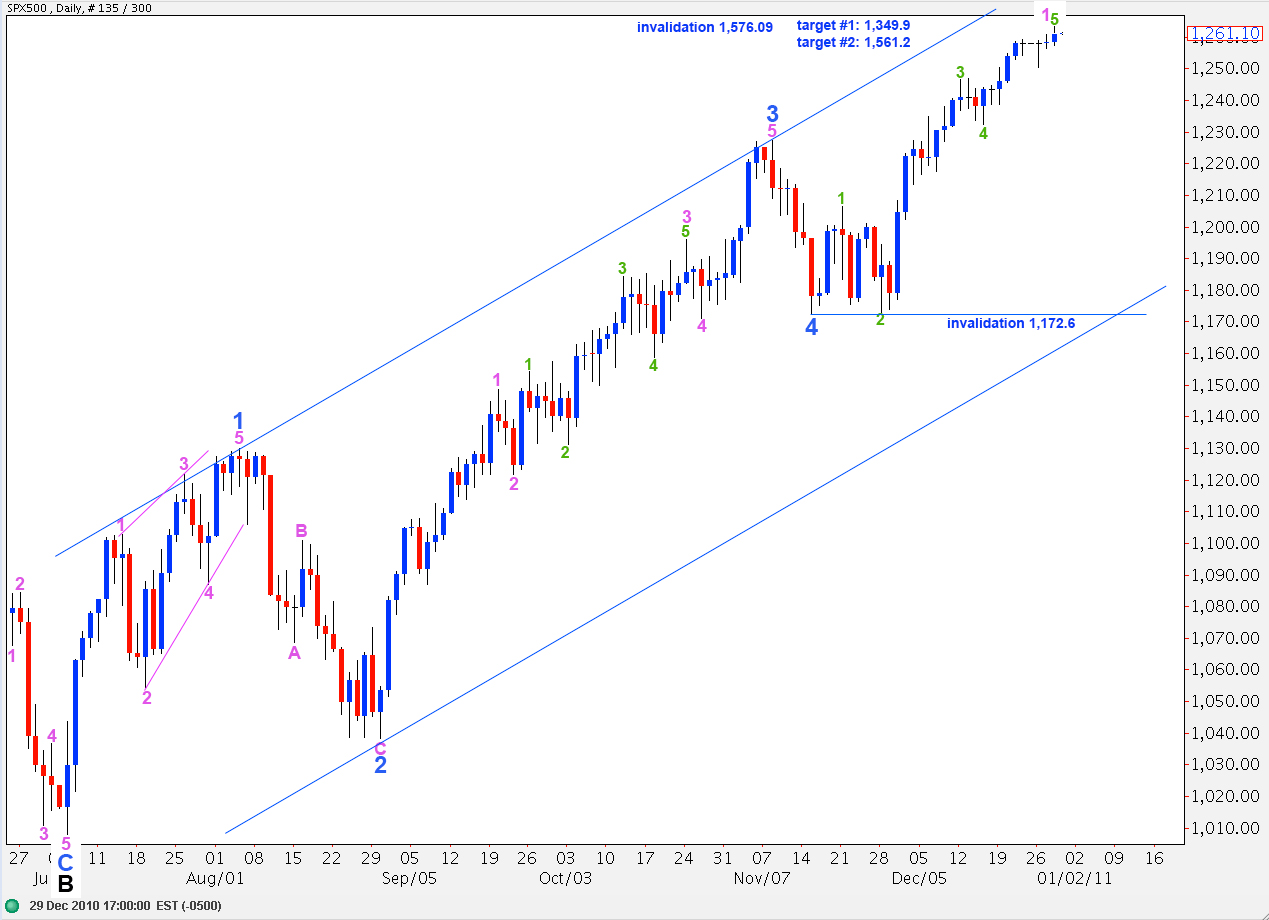
This wave count remains valid. If we see a new high above 1,263.4 then the probability that this wave count is correct will increase significantly.
This wave count sees wave 5 blue to end wave C at intermediate (black) degree as unfolding. It may be over, if we move the degree of labeling for wave 5 blue up one degree. Or only the first wave within wave 5 blue may be ending, if this degree of labeling is correct.