
Elliott Wave chart analysis for the SPX500 for 27th December, 2010. Please click on the charts below to enlarge.
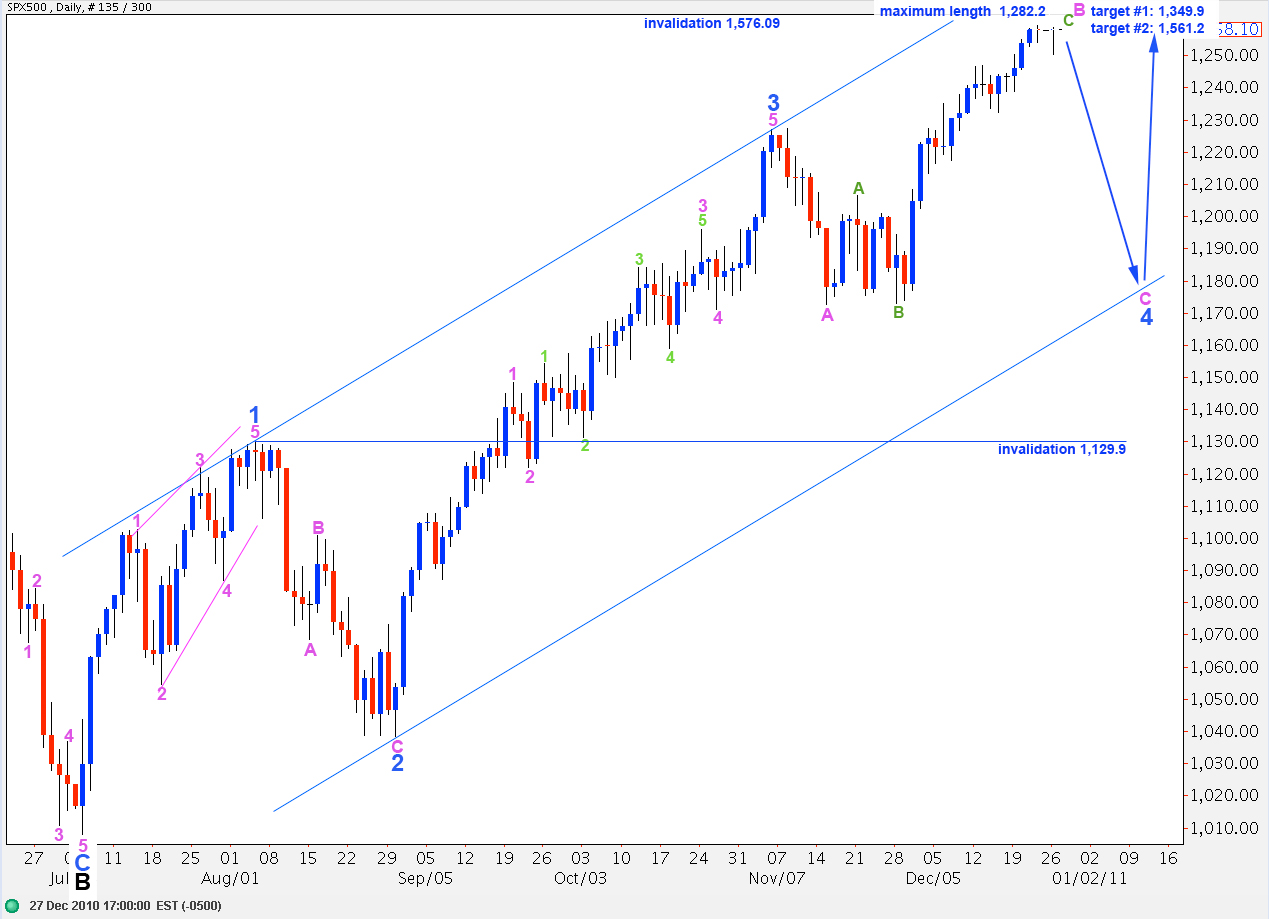
The S&P has completed a fourth wave correction and turned back up. We should see one more fourth wave correction and one final upward wave toward about 1,262 before we see a trend change at minute (pink) degree, which will take price lower for at least a couple of weeks or so.
In the long term we may see wave C black end about 1,349.9 where it reaches 0.618 the length of wave A black, or at 1,561.2 where it reaches equality with wave A black. This second target is more likely as equality is the most common relationship between waves A and C.
Upward movement may not move above 1,576.09 as primary wave 2 may not move beyond the end of primary wave 1.
Downward movement for this wave count may not move below 1,129.9 as wave 4 blue may not move into wave 1 blue price territory. If this wave count is invalidated by downward movement then we must consider the possibility that primary wave 2 is over and primary wave 3 is underway.
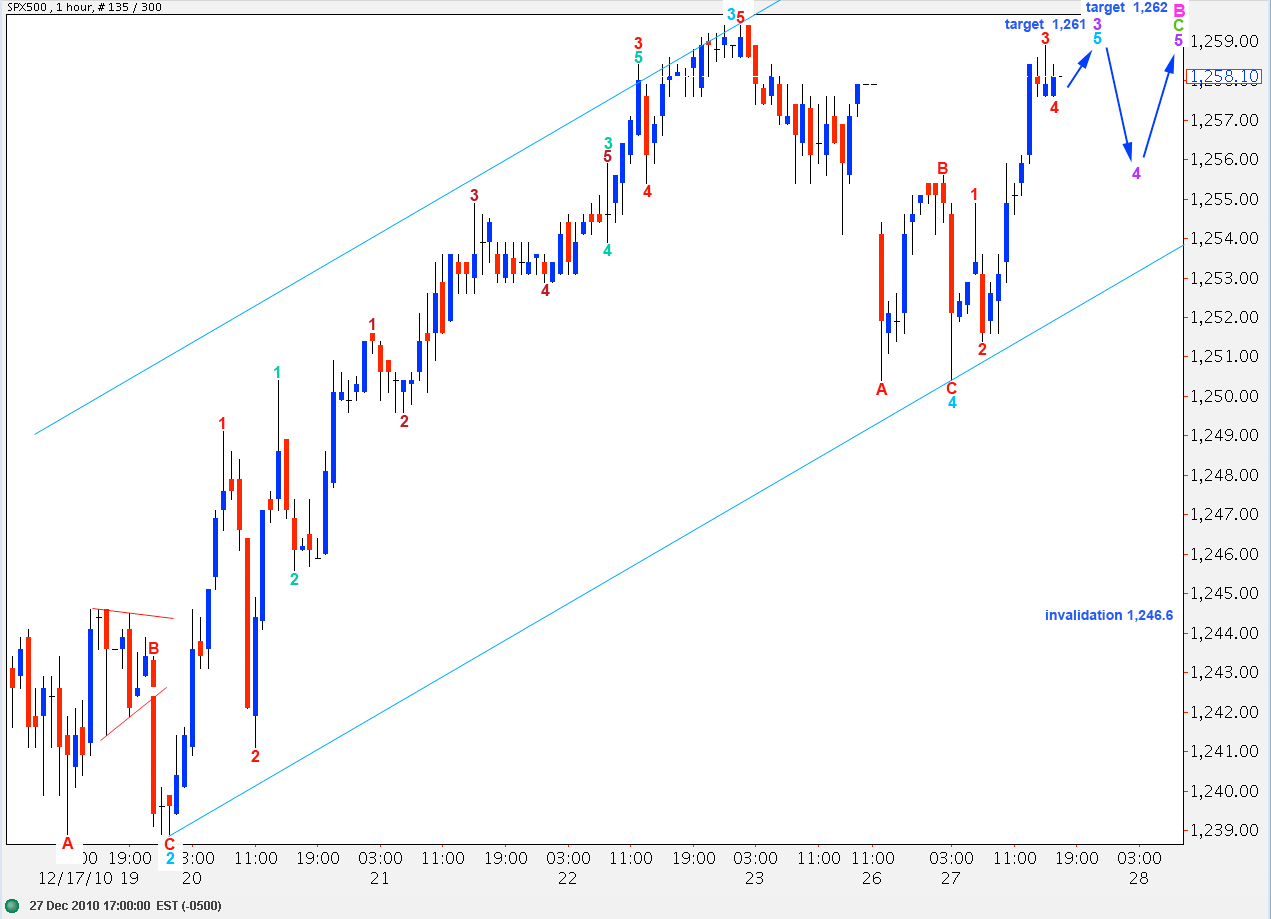
We were expecting that wave 4 aqua was over at 1,254.1 but the new trading week opened with further downward movement.
Thereafter, price turned back up which was expected.
Within wave 4 aqua wave C red is just 0.4 short of 0.618 the length of wave A red.
Within upward movement for wave 5 aqua to end wave 3 purple wave 3 red is just 0.2 short of 1.618 the length of wave 1 red. It seems most likely that upward movement will make a slightly higher high to end wave 5 red for 3 purple.
Thereafter, we should expect one more fourth wave correction, this time at purple degree, to about 1,250.4 being the fourth wave of one lesser degree.
Wave 4 purple may not move into wave 1 purple price territory. Therefore, this wave count is invalidated with movement below 1,246.6.
Wave 5 purple to end wave 5 orange to end wave C green may end about 1,262 where wave C green will be 2.618 the length of wave A green.
If this wave count is invalidated with downward movement below 1,246.6 then we must consider the possibility that wave B pink is over and wave C pink has begun.
Wave C pink will be confirmed with price movement below 1,217.6.
This trend channel is drawn using Elliott’s technique around wave 3 purple. It may provide guidance to where the next upward wave may end: either midway in the channel or at the upper end of the channel.
Alternate Daily Wave Count.
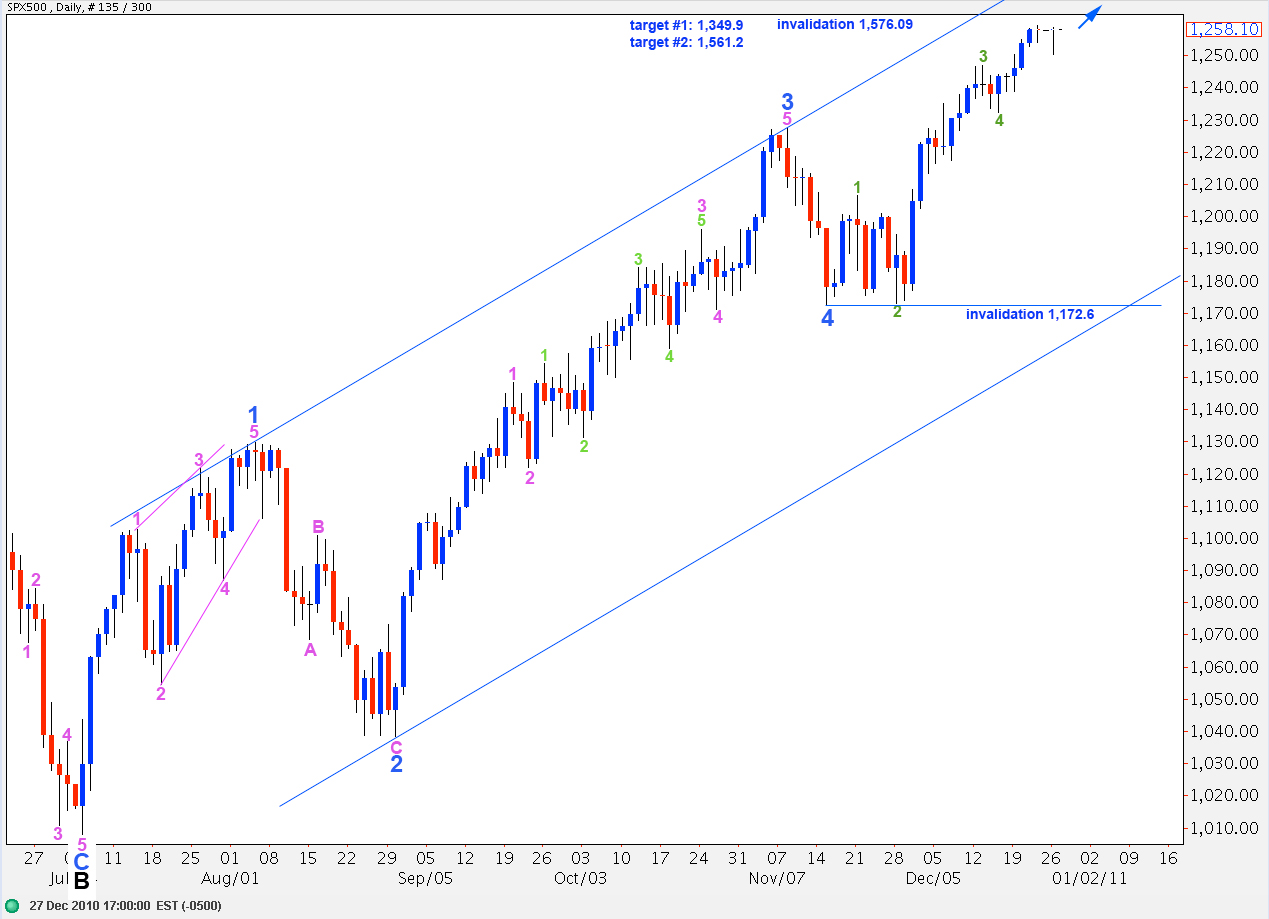
This alternate wave count sees wave 4 blue as brief, only 6 days in duration. It is out of proportion to wave 2 blue and for that reason I do not favour this wave count.
If this wave count is correct then wave 5 blue may be nearing completion, or only wave 1 pink would be nearing completion.