
Elliott Wave chart analysis for the SPX500 for 22nd December, 2010. Please click on the charts below to enlarge.

The S&P has moved higher again as expected from yesterday’s analysis. We should expect a little further upward movement yet before this trend is over. There is strong continuing divergence with price trending higher and MACD trending lower on 15 minute, 1 hour and 4 hourly charts.
When upward movement is over for wave B pink we should expect strong downward movement for wave C pink to end this expanded flat correction for wave 4 blue.
In the long term we may see wave C black end about 1,349.9 where it reaches 0.618 the length of wave A black, or at 1,561.2 where it reaches equality with wave A black. This second target is more likely as equality is the most common relationship between waves A and C.
Upward movement may not move above 1,576.09 as primary wave 2 may not move beyond the end of primary wave 1.
Downward movement for this wave count may not move below 1,129.9 as wave 4 blue may not move into wave 1 blue price territory. If this wave count is invalidated by downward movement then we must consider the possibility that primary wave 2 is over and primary wave 3 is underway.
I have taken another look at wave C green and have an adjusted wave count for you today on a 4 hourly chart. The wave count presented yesterday remains valid, but this one has a slightly better fit.
Our first indication that the trend has changed may come with a channel breach to the downside. I have channels on both 4 hourly and 1 hourly charts for you. We will have our first confirmation of a trend change with movement below 1,246.6 and further confirmation with movement below 1,217.6.
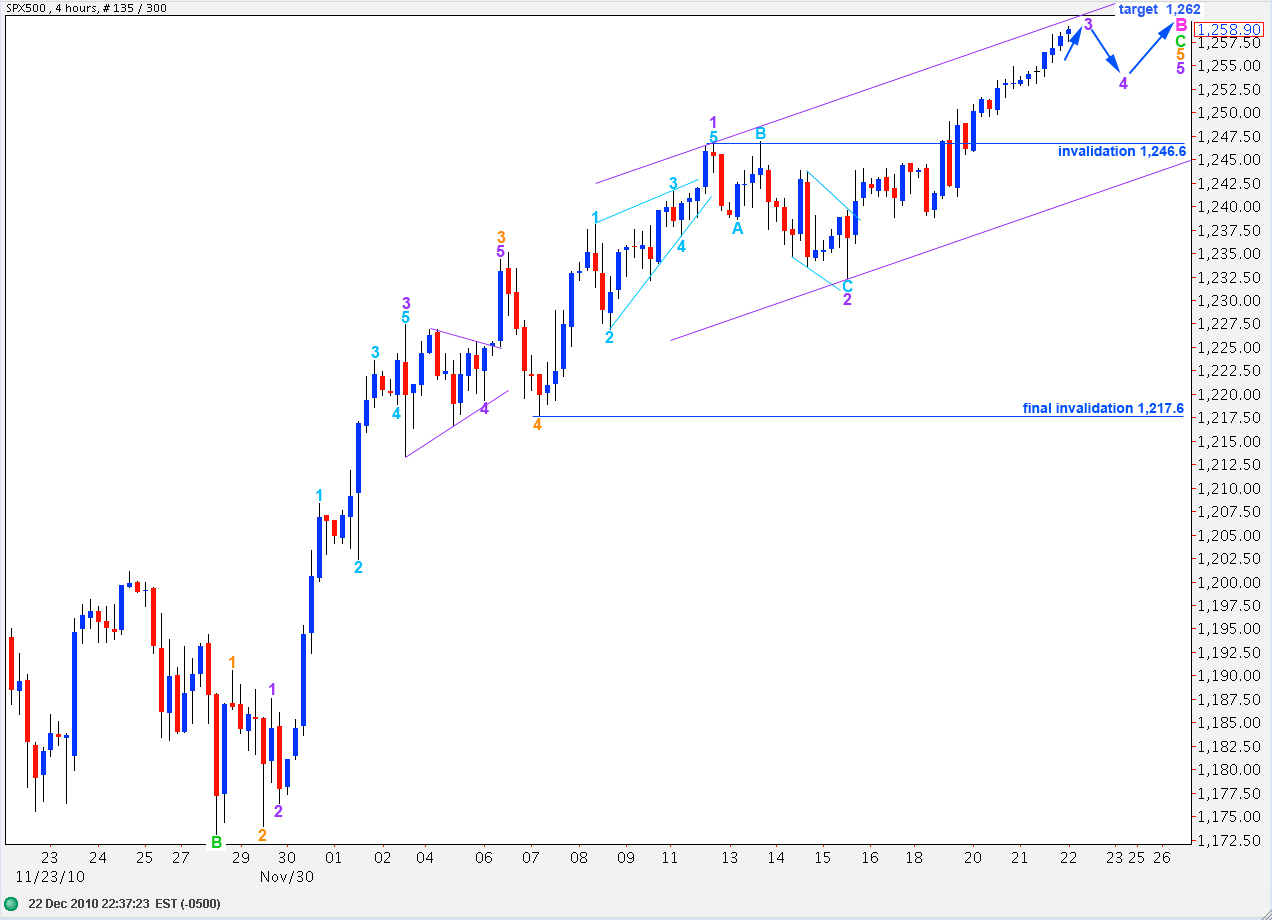
This 4 hourly chart details all of wave C green. The labels for orange waves 1, 2, 3 and 4 are unchanged. Labels within wave 5 orange for purple waves have been changed here.
We may not yet have an end to wave 3 purple. If this wave count is correct then wave 4 purple may not move into wave 1 purple price territory. Therefore, this wave count is invalidated with movement below 1,246.6.
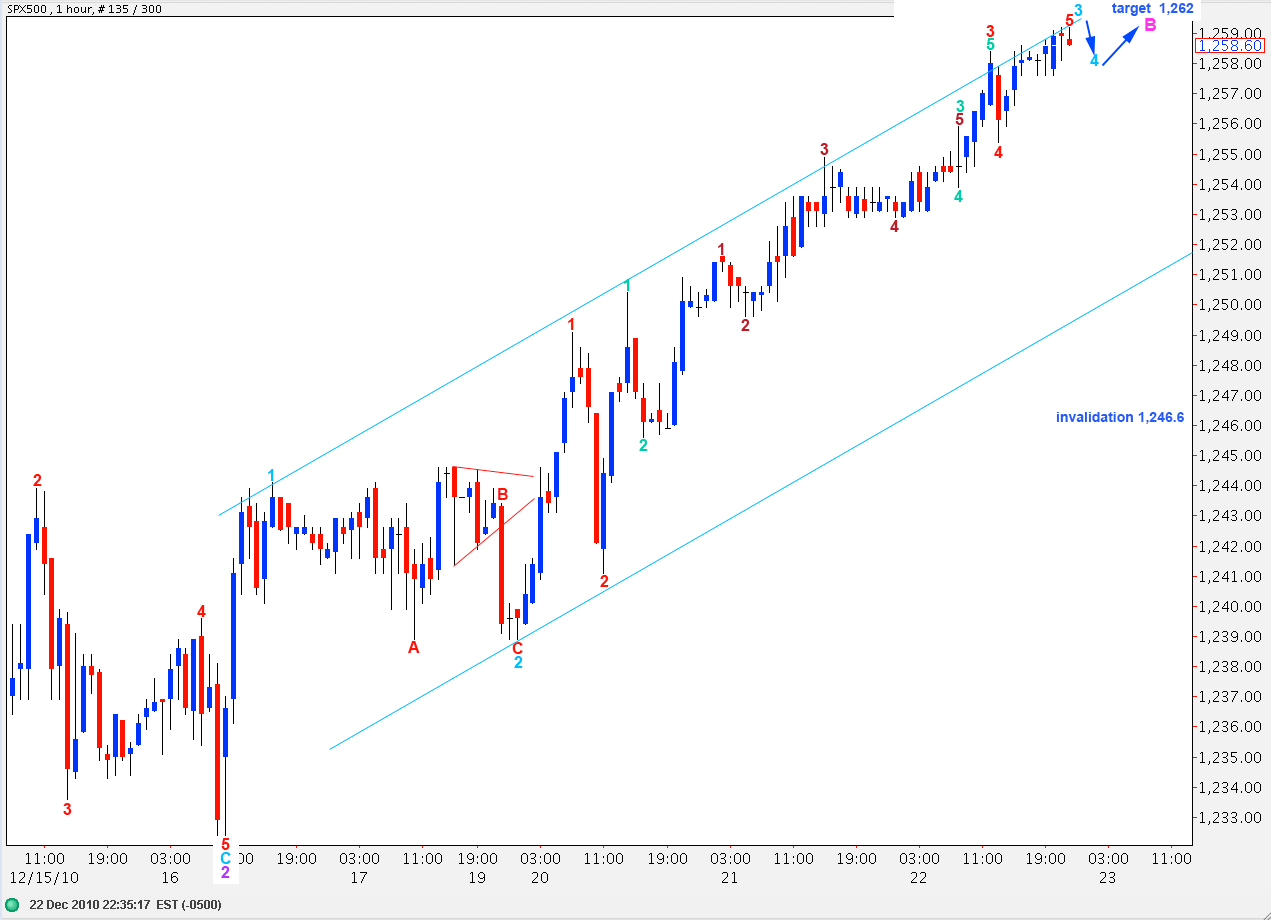
This hourly chart details wave 3 purple.
Within wave 3 purple wave 3 aqua is just 1.6 points short of 1.618 the length of wave 1 aqua.
Ratios within wave 3 aqua are: wave 3 red is just 0.8 points longer than 1.618 the length of wave 1 aqua and wave 5 aqua is exactly 0.382 the length of wave 1 aqua.
Ratios within wave 3 red are: wave 3 teal is 1 point longer than equality with wave 1 teal and wave 5 teal is 0.9 points short of 0.382 the length of wave 1 teal.
Ratios within wave 3 teal are: wave 3 maroon is 0.7 points short of equality with wave 1 maroon and wave 5 maroon is 0.3 short of 0.618 the length of wave 3 maroon.
We may see a small fourth wave correction and another small upward wave to end wave 3 purple. Thereafter, we may see a larger fourth wave correction at purple degree and one final upward wave to end wave 5 purple which will end wave 5 orange, wave C green, and wave B pink.
The target of 1,262 for wave C green to reach 2.618 the length of wave A green seems reasonable for this wave count.
Alternate Daily Wave Count.

This alternate wave count sees wave 4 blue as brief, only 6 days in duration. It is out of proportion to wave 2 blue and for that reason I do not favour this wave count.
If this wave count is correct then wave 5 blue may be nearing completion, or only wave 1 pink would be nearing completion.