
Elliott Wave chart analysis for the SPX500 for 20th December, 2010. Please click on the charts below to enlarge.
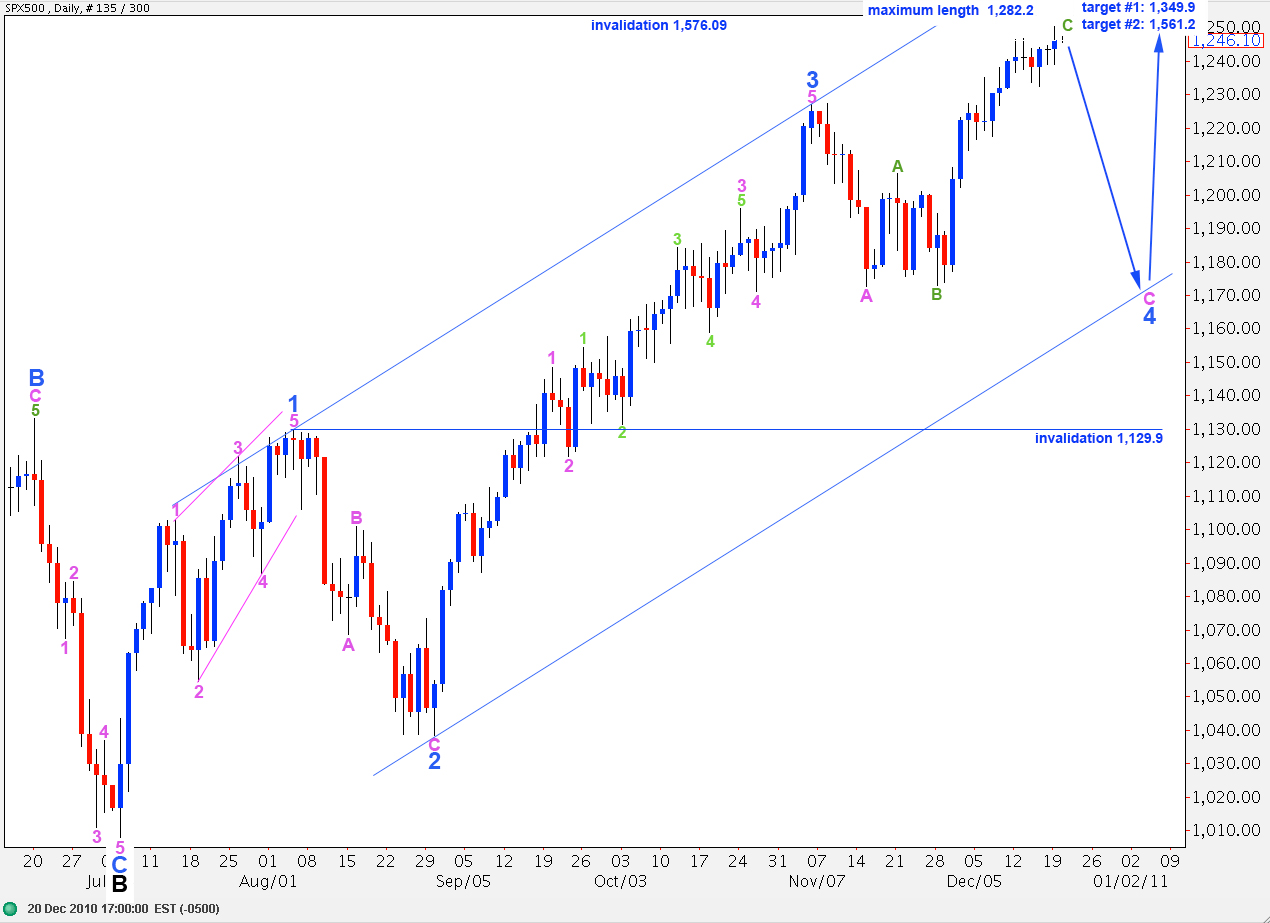
Upward movement has invalidated the main wave count and confirmed the alternate. We should expect a slow drawn out end to this C wave at pink (minute) degree.
Wave 4 blue may still unfold as an expanded flat correction. So far pink wave B within wave 4 blue for this wave count has just reached above 138% of pink wave A. It is at this stage well within the allowable limit at 1,282.2.
In the long term we may see wave C black end about 1,349.9 where it reaches 0.618 the length of wave A black, or at 1,561.2 where it reaches equality with wave A black. This second target is more likely as this is the most common relationship between the two.
Upward movement may not move above 1,576.09 as primary wave 2 may not move beyond the end of primary wave 1.
Downward movement for this wave count may not move below 1,129.9 as wave 4 blue may not move into wave 1 blue price territory. If this wave count is invalidated by downward movement then we must consider the possibility that primary wave 2 is over and primary wave 3 is underway.
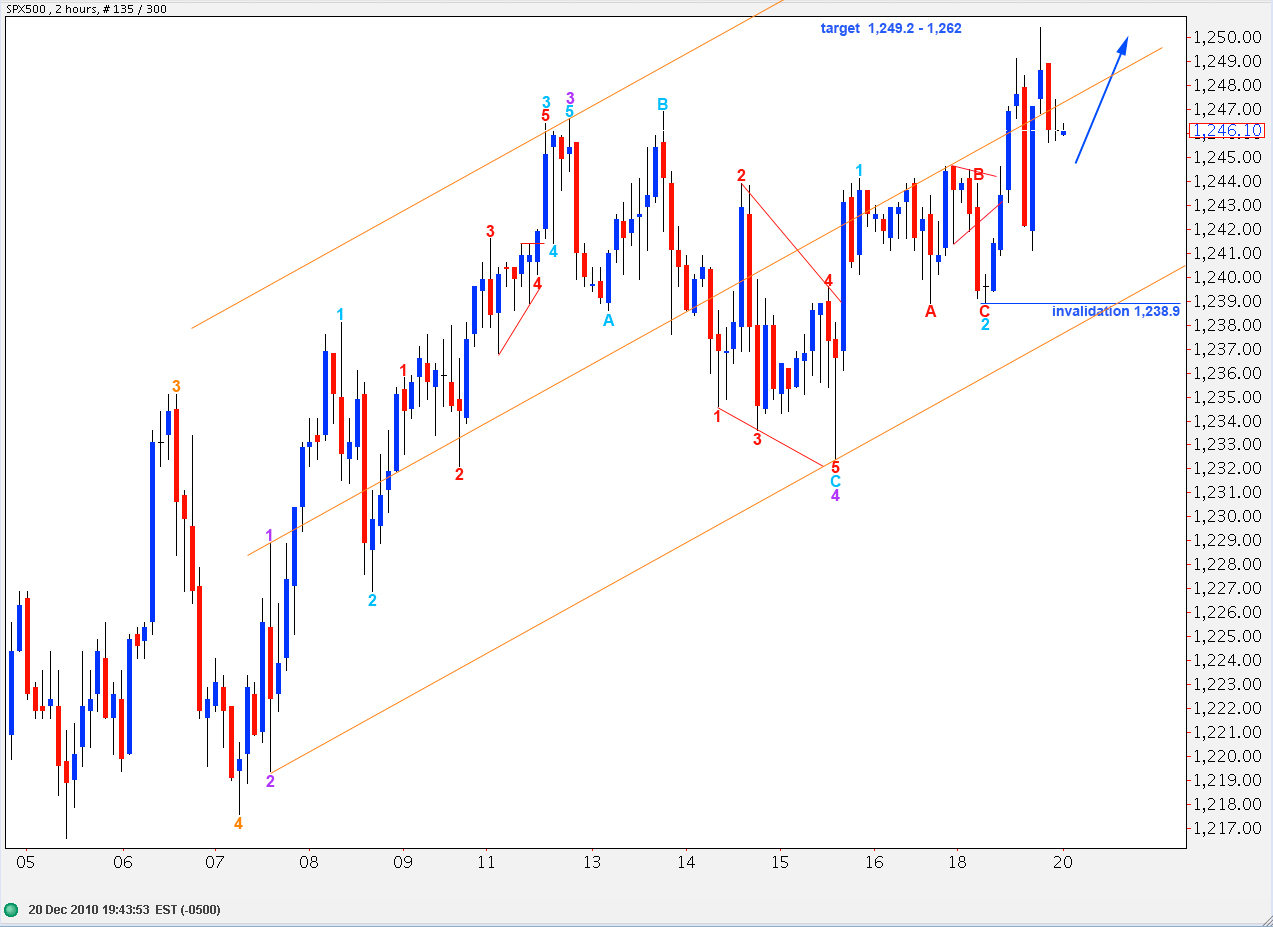
I have reanalysed upward movement for wave C green. This 2 hourly chart details the last wave within wave C green, wave 5 orange. I have altered the labeling here for the end to waves 3 and 4 orange. When looking at this C wave on a 4 hourly chart this seems the best fit for waves 1 through to 4.
Within wave C green wave 3 orange has no fibonacci ratio to wave 1 orange. At 1,255.4 wave 5 orange will reach 0.618 the length of wave 3 orange; this is within the target zone.
Within wave 5 orange wave 3 purple is just 2.4 points short of 2.618 the length of wave 1 purple.
Within wave 5 orange wave 2 purple is a sharp zigzag and wave 4 purple is a flat correction.
I have created a double wide parallel channel around wave 5 orange. First a trend line drawn from the ends of 2 to 4 purple, then parallel copies placed on the highs of 1 and 3 purple. Wave 5 purple may end about the midline. When price moves below the lower end of the channel we will have an early indication that the trend may have changed.
This wave count is invalidated with movement below 1,238.9 as any second wave correction within wave 3 aqua may not move beyond the start of the first.
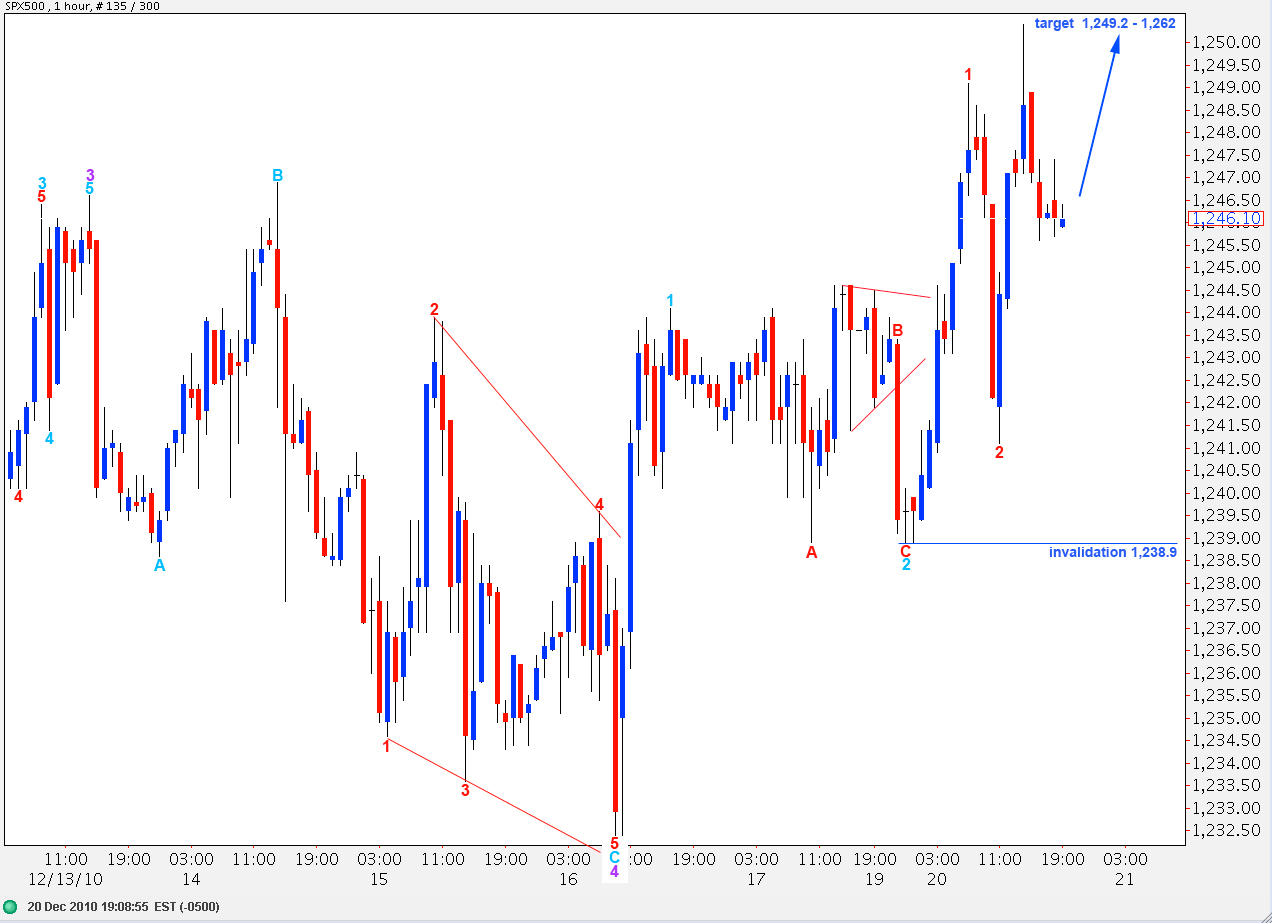
This hourly chart details recent movement for waves 4 and 5 purple of wave 5 orange.
Wave 4 purple is a flat correction and wave C within it is an ending diagonal.
Thereafter, wave 5 purple is unlikely to be a diagonal, as wave 2 aqua within it is either a flat or very possibly an expanding triangle.
At 1,249.2 wave 5 purple will reach 0.618 the length of wave 3 purple.
At 1,255.42 wave 5 orange will reach 0.618 the length of wave 3 orange.
At 1,262 wave C green will reach 2.618 the length of wave A green.
Upward movement for this wave count may move no higher than 1,282 as wave B pink may not be longer than twice the length of wave A pink. If this point is breached then we must use the alternate wave count below.
Alternate Daily Wave Count.
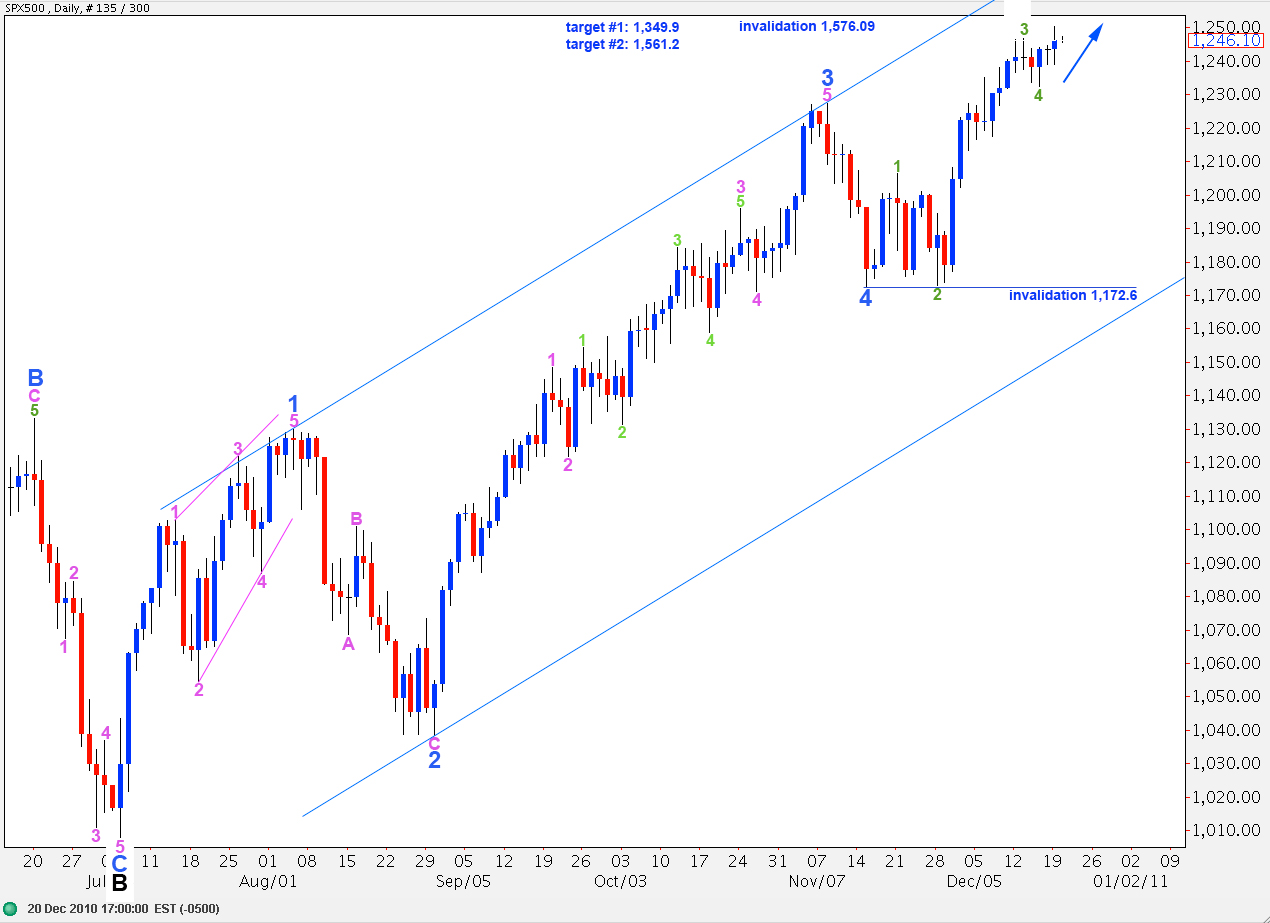
This wave count sees wave 4 blue as over, and remarkably brief, lasting only 6 days. However, with further upward movement this wave count continues to be technically valid.
Movement below 1,172.6 would invalidate this wave count.