
Elliott Wave chart analysis for the SPX500 for 13th December, 2010. Please click on the charts below to enlarge.
The S&P has behaved as expected for Monday’s session. Price has ended 1.7 points short of the small target zone on the hourly chart.
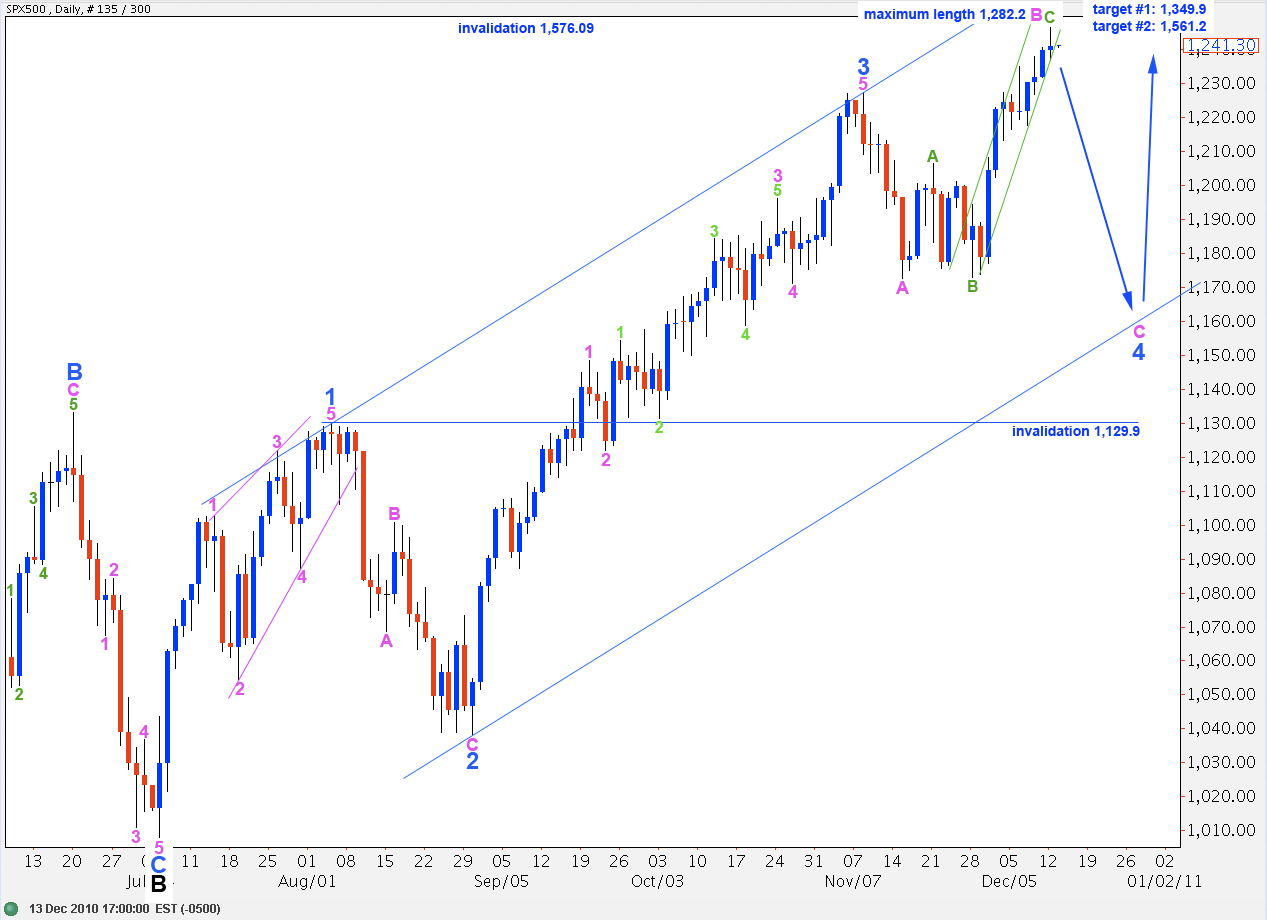
We may have an end to pink wave B within wave 4 blue expanded flat correction. If this is the case we should shortly see a candlestick outside the lower edge of the small green parallel channel drawn here about wave C green of wave B pink on the daily chart.
Alternately, it is also possible that we may yet see a long drawn out extension higher of wave C green to end wave B pink. Wave B pink has a maximum allowable length of twice the length of wave A pink for a flat correction, which is at 1,282.2. If price carries above this point then our alternate daily wave count will be correct.
If price moves below 1,232.1 we may expect it is likely that we have seen a trend change to the downside and wave C pink is underway. Thereafter, further confirmation will come from a trend channel breach here on the daily chart (green channel).
Please use caution. At this stage we may be at a turning point. Expect that the trend remains up until proved otherwise and remember that trying to pick tops too often exposes your account to risk. The safest approach about trend changes is to exercise patience and wait for confirmation before entering the market in the new direction. Alternately, protect profits of long positions if you choose to keep them open.
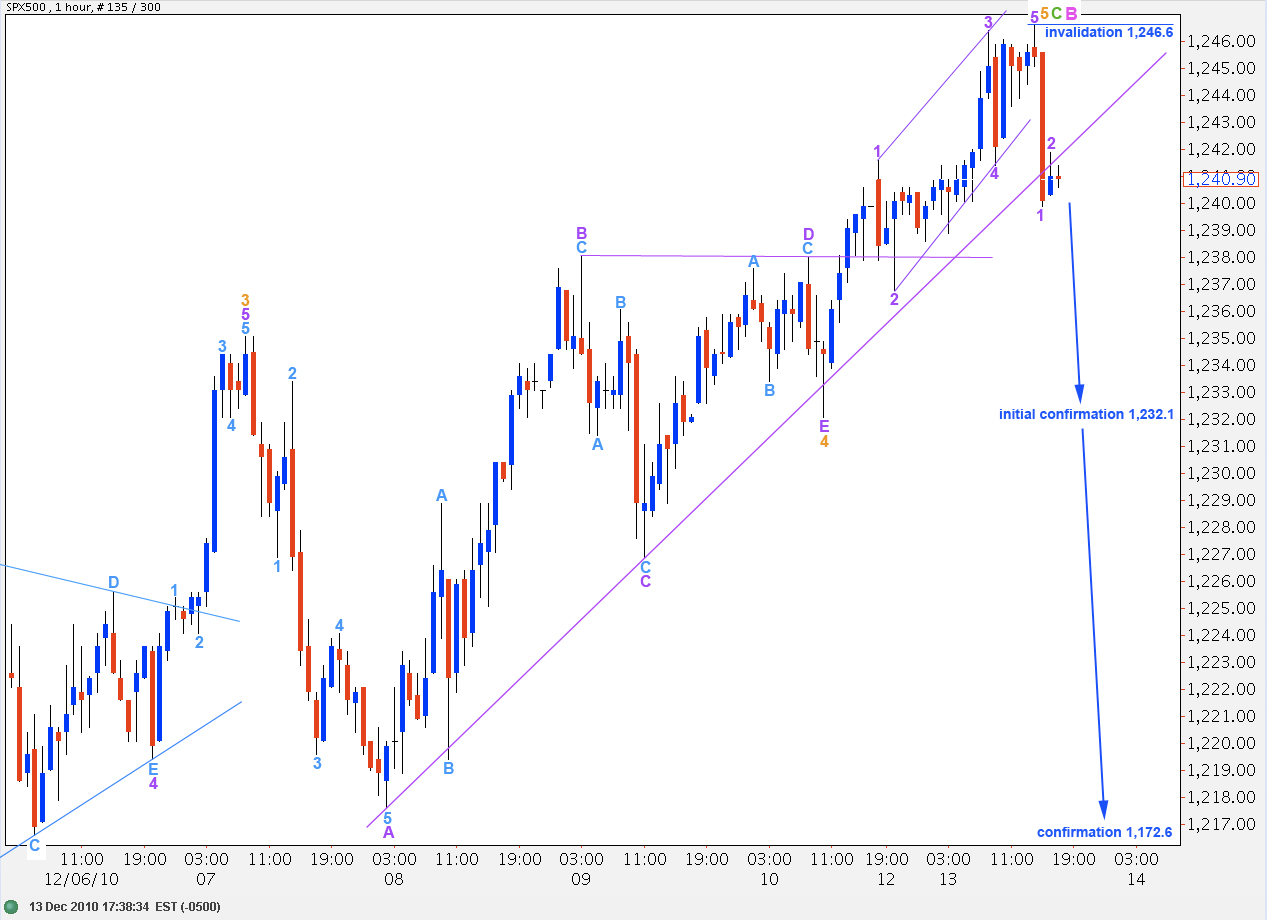
Fifth wave behaviour following barrier triangles tells us to expect one of two things: either a short sharp thrust or a very long extension. With this in mind I have two hourly wave counts for you. We may use the differentiation point of 1,232.1 to determine which is correct in coming sessions.
This main wave count (which I favour only slightly) expects wave B pink is over. Wave B pink within this expanded flat fourth wave at minor degree is a 135% correction of wave A pink, which is exactly within the length guidelines tell us to expect.
Within wave B pink wave C green has no fibonacci ratio to wave A green.
Ratios within wave C green are: wave 3 orange has no fibonacci ratio to wave 1 orange and wave 5 orange is 3 points short of equality with wave 1 orange.
Wave 5 orange is seen here as an ending contracting diagonal; all subwaves break down into zigzags when viewed on a 15 minute chart. Wave lengths meet rules for a contracting diagonal.
This wave count will initially be confirmed with movement below 1,232.1 as that is the point at which the alternate hourly wave count will be invalidated.
Any movement above 1,246.6 will immediately invalidate this wave count and at that stage we should use the alternate below.
Alternate Hourly Wave Count.
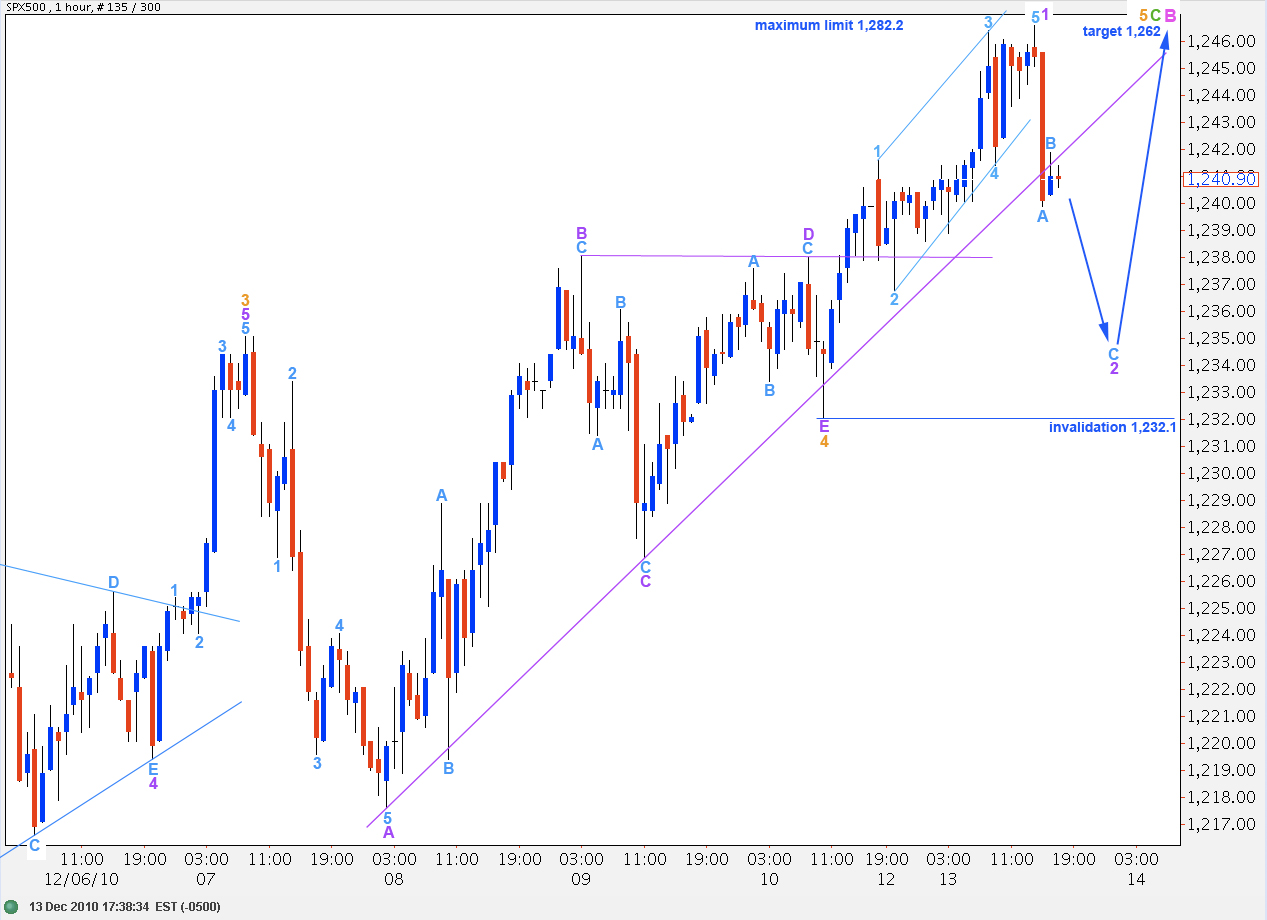
This wave count differs only from the main wave count in the degree of labeling of the last five wave structure up.
We may have only seen a leading contracting diagonal for wave 1 purple within wave 5 orange.
This wave count is invalidated with price movement below 1,232.1.
At 1,262 wave C green will reach 2.618 the length of wave A green. As wave C green has passed equality, and passed 1.618 the length of wave A green, the next likely end is 2.618 its length.
If this wave count is correct we should be expecting a long drawn out extension of wave 5 orange. Wave B pink may not move above 1,282.2. If price moves above this point then the alternate daily wave count below will be correct.
Alternate Daily Wave Count.
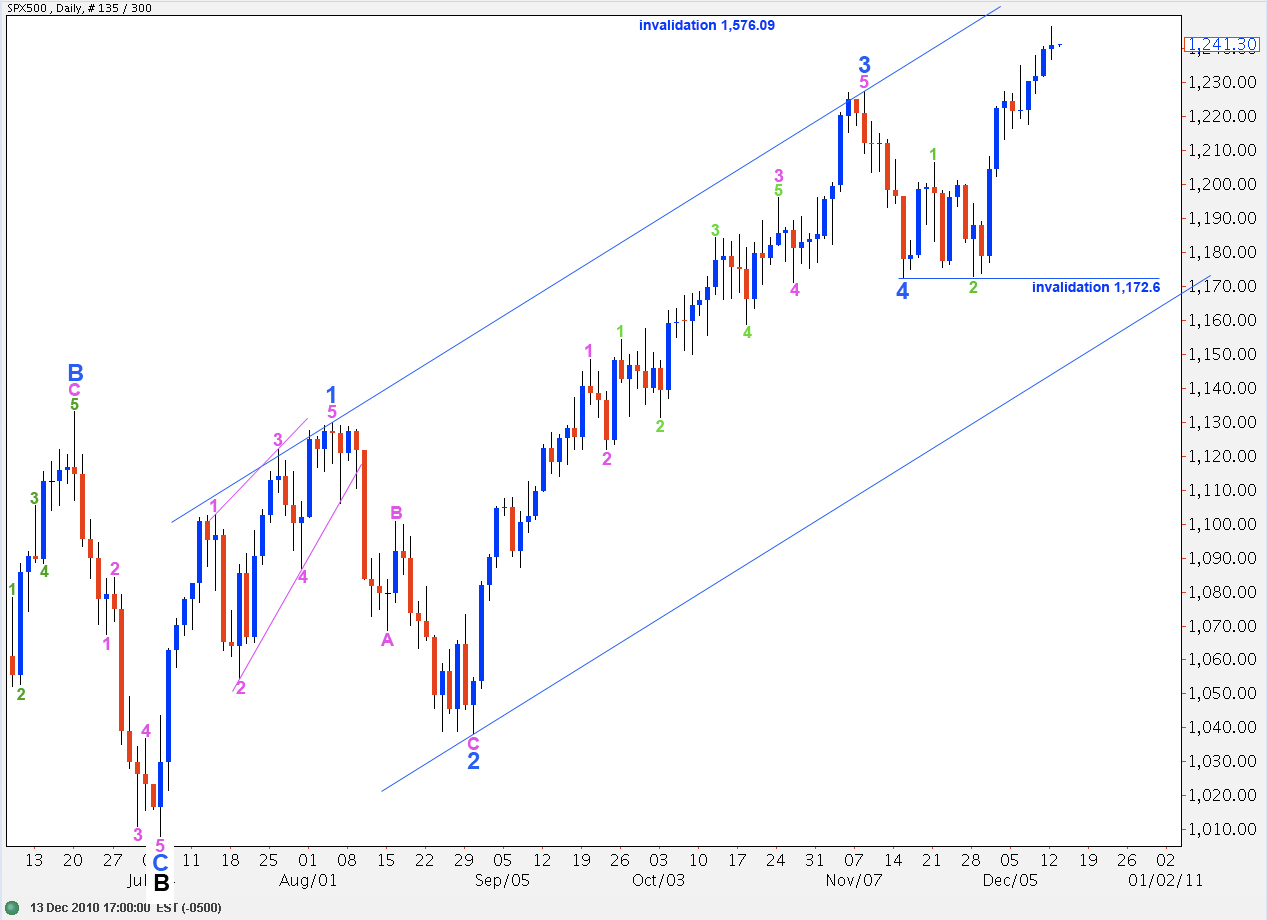
Wave 4 blue may have been brief and shallow and over at 1,172.6.
Movement above 1,282.2 will confirm this wave count as that is where the main wave count would be invalidated.
This wave count expects further upward movement for wave 5 blue is most likely. However, at this stage there is a slim outlying possibility that wave 5 blue could be considered complete and, therefore, primary wave 2 could have ended.
If upward movement for primary wave 2 is over then ratios are:
There is no adequate fibonacci ratio between waves A and C at intermediate degree (black) and wave C is 103.3 points short of 0.618 the length of black wave A, which is too far to say there is a fibonacci ratio between them.
At minor (blue) degree within black wave C ratios are: wave 3 blue is just 8.2 points short of 1.168 the length of blue wave 1 and blue wave 5 is just 1.3 points short of 0.618 the length of blue wave 1. These are very good ratios. However, a more common relationship between waves 1 and 5 when 3 is extended is one of equality.
I am aware of the slim outlying possibility that primary wave 2 could be over, but to say this is likely seems at this stage very premature. Movement below 1,129.9 would confirm an end to primary wave 2.