
Elliott Wave chart analysis for the SPX500 for 9th December, 2010. Please click on the charts below to enlarge.
Upward movement has invalidated the main wave count on the hourly chart. Wave B pink is extending a little higher.
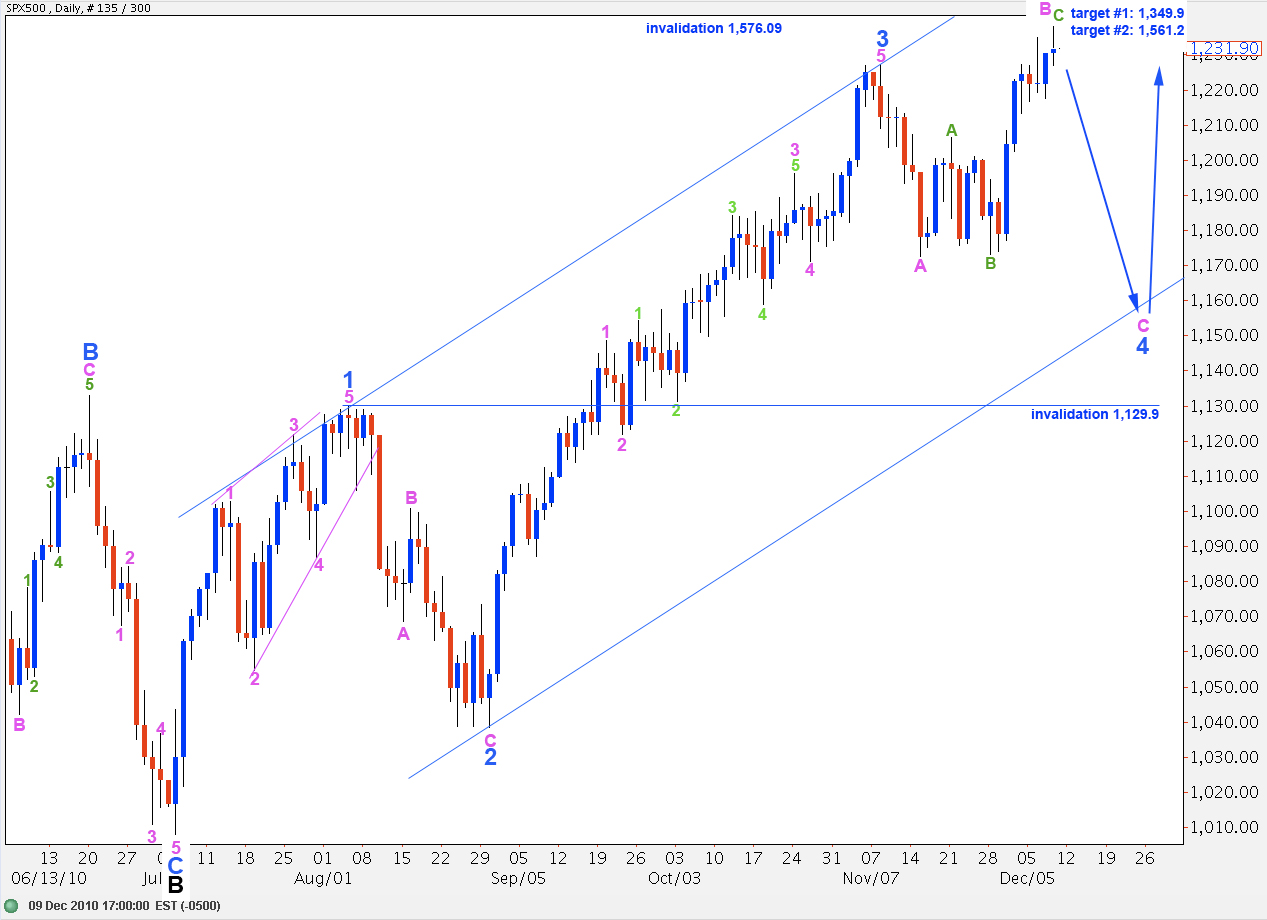
This wave count still seems to be the best fit on the daily chart. When wave B pink is complete we may expect a strong C wave to complete wave 4 blue expanded flat correction.
When we know where wave B pink has ended then we may calculate a target for wave C pink to end this fourth wave correction.
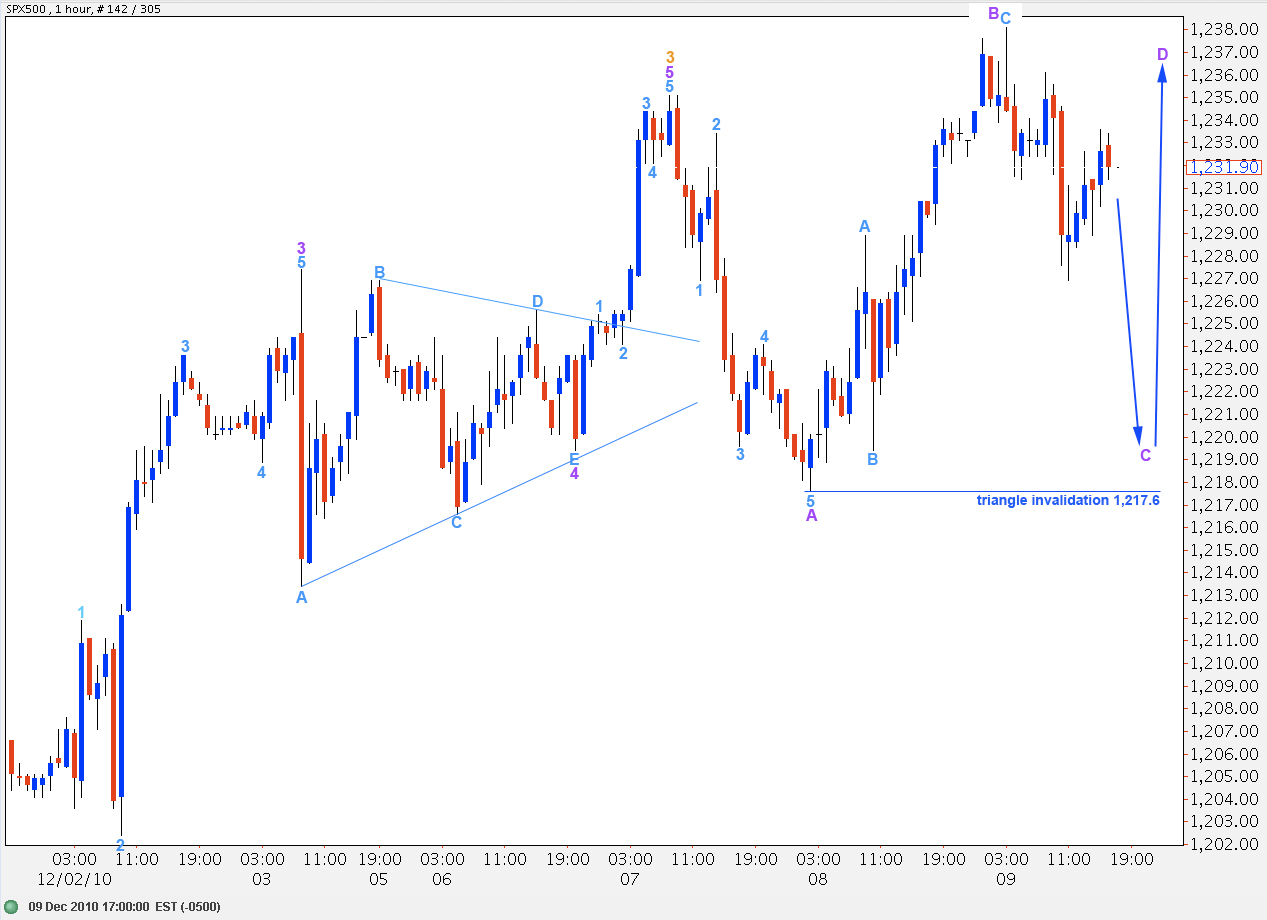
If we see downward movement, labeled here as wave A purple, as a five wave structure then the only option would be a running triangle unfolding in a fourth wave position.
We should expect a zigzag to the downside for wave C purple which cannot move beyond the end of wave A purple below 1,217.6.
Thereafter, we should expect another zigzag to the upside for wave D purple which may not move beyond the end of wave B purple at 1,238.1 (although for a barrier triangle wave D may end about the level of wave B, which may be very slightly above this point).
Thereafter, a final zigzag to the downside for wave E purple would complete a triangle for wave 4 green of this wave C pink impulse.
Alternate Wave Count.
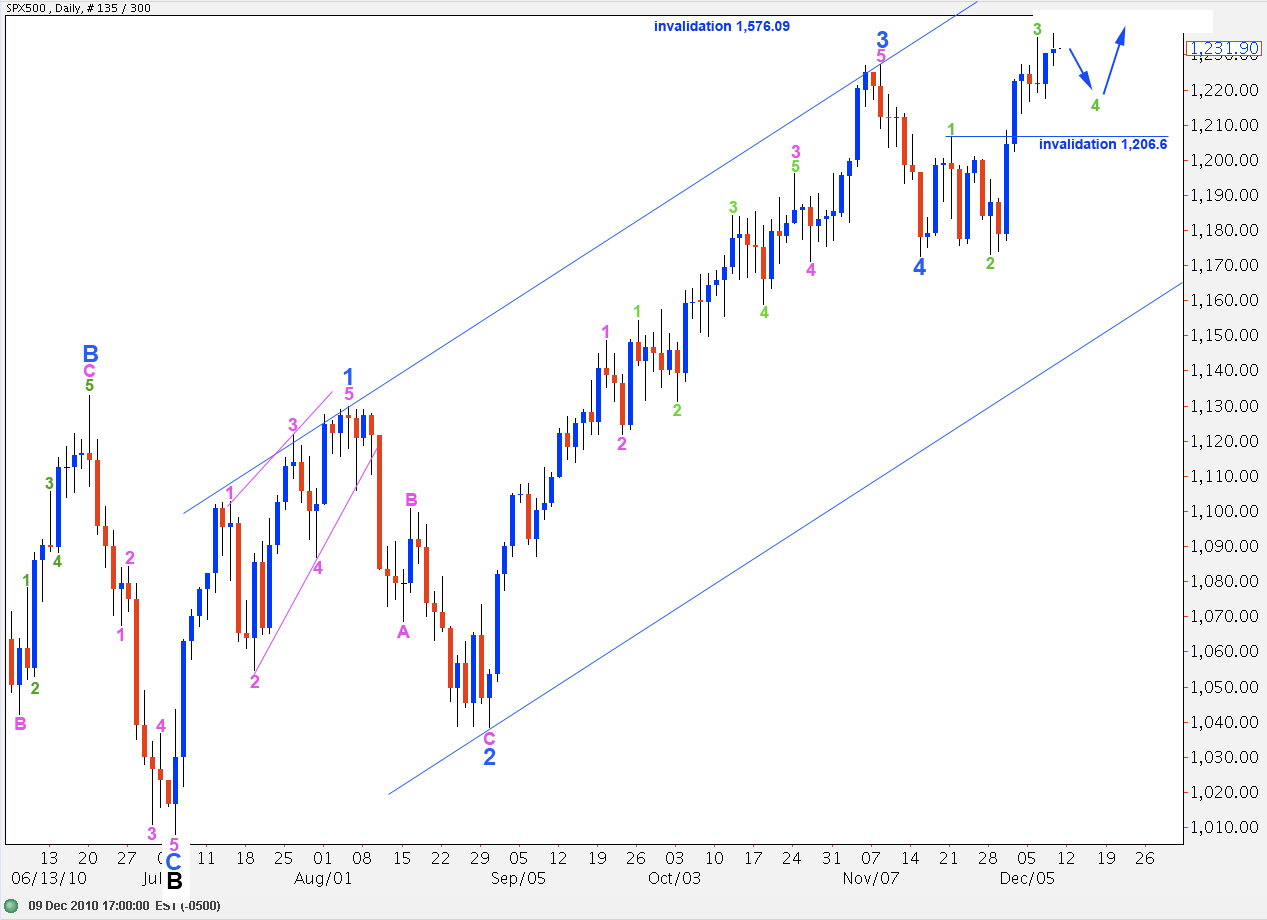
This alternate wave count remains valid. We should expect exactly the same direction of movement next as the main wave count.
This alternate wave count sees wave 4 blue as over and upward movement as the start of wave 5 blue to end wave C black of primary wave 2.
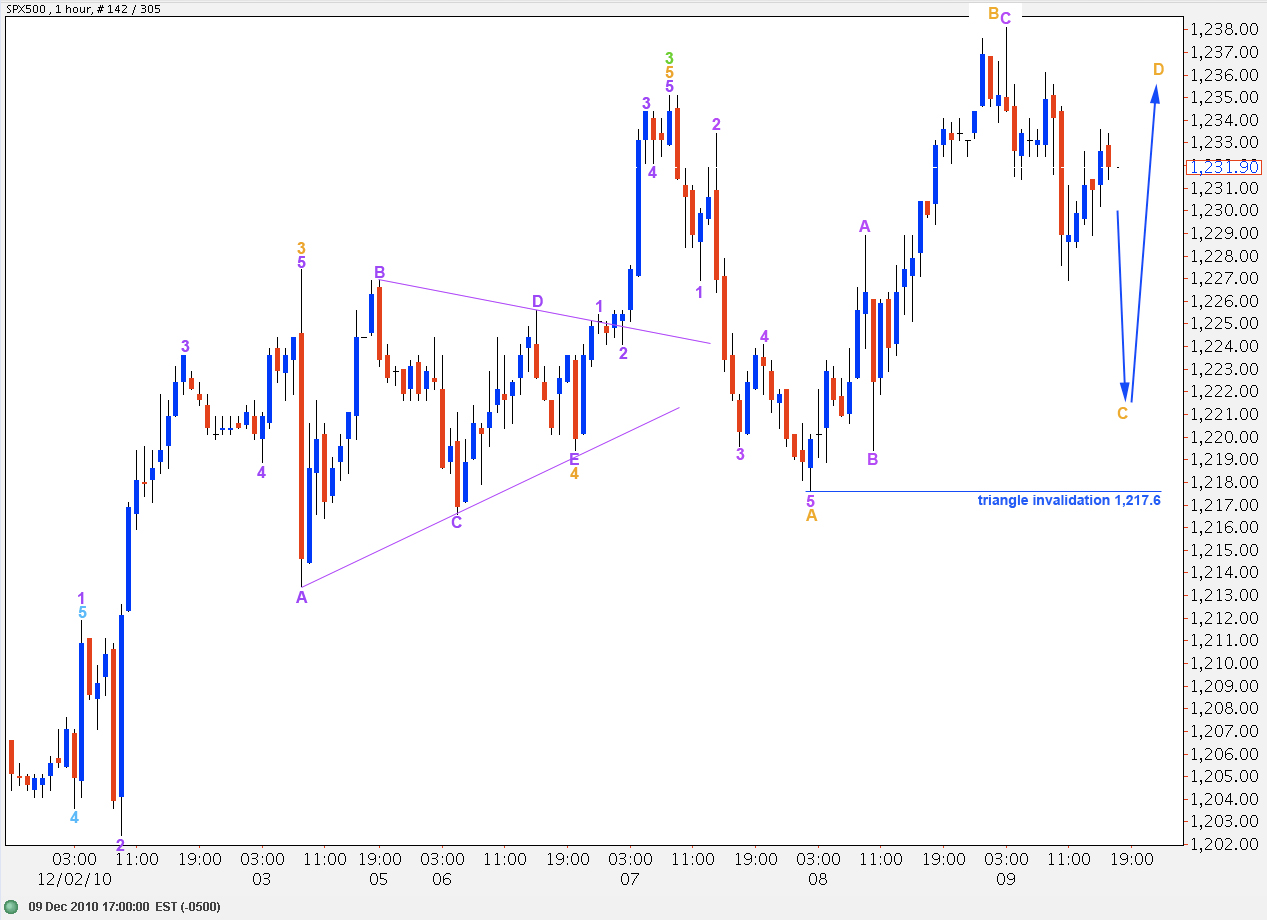
This alternate wave count is the same as the main wave count on the hourly chart, with the exception of the degree of labeling. This alternate wave count expects a contracting or barrier triangle to complete a fourth wave correction.