
Elliott Wave chart analysis for the SPX500 for 7th December, 2010. Please click on the charts below to enlarge.
As expected we saw a little movement above 1,227.4 to end just 1 point above the target on the hourly chart. Thereafter, as expected, the S&P has turned downward.
We should expect continuing downward movement today as a C wave at pink (minute) degree unfolds.
Wave 4 blue is an expanded flat correction; it has a B wave (pink) which is now a 114% correction of wave A.
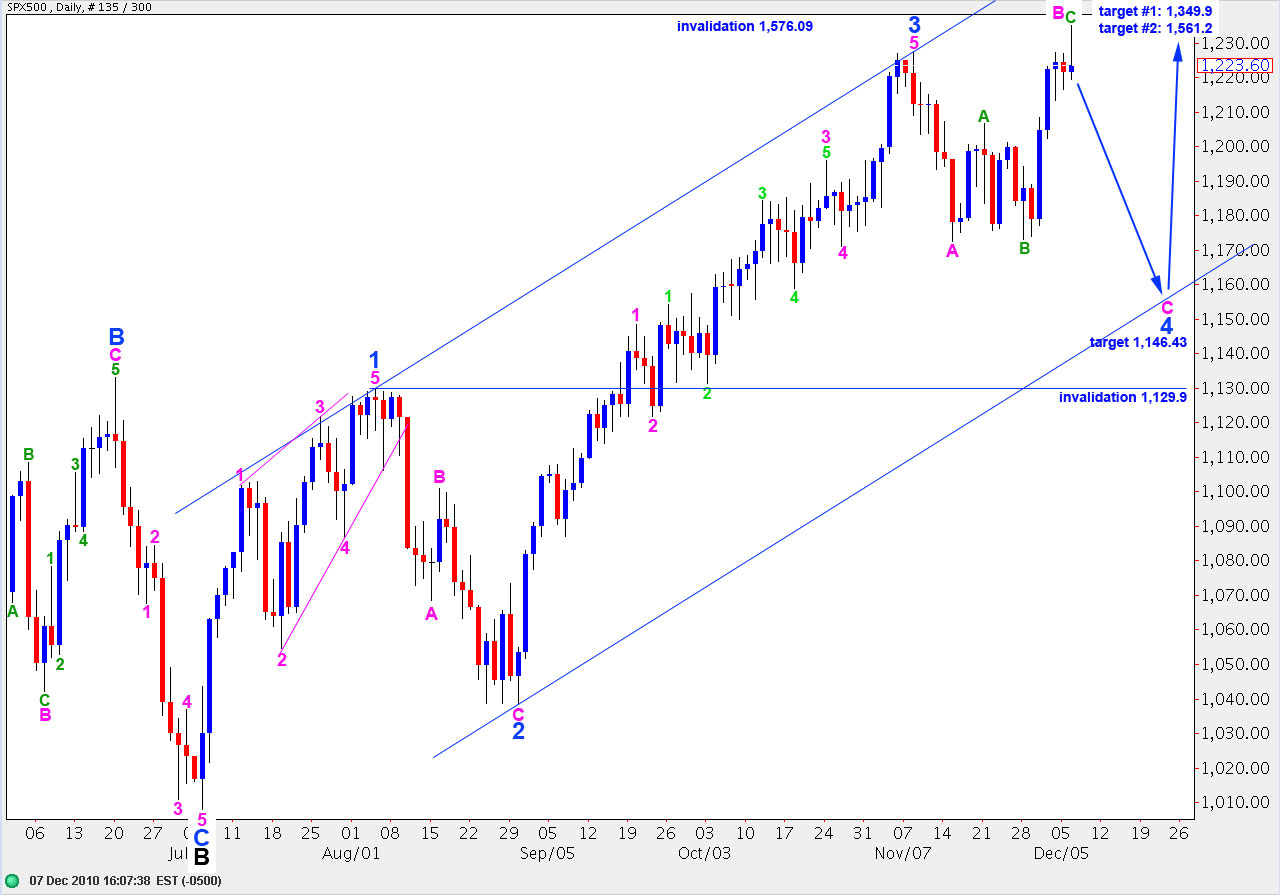
On the daily chart this main wave count is looking very good. We can see a clear three wave structure for wave B green within B pink, and now a clear five wave structure for wave C green to end wave B pink.
Wave B pink within wave 4 blue is a flat correction. Wave B green within it was a 99% correction of wave A green and wave C green is 7 points longer than 1.618 the length of wave A green.
We may expect wave C pink to end this expanded flat for wave 4 blue to be 1.618 the length of wave A pink. This will be achieved at 1,146.43. This would bring price close to the lower end of the wide blue parallel channel containing wave C black to the upside. This is where we should expect wave 4 blue to end, possibly with a small overshoot of the channel.
The alternate wave count which expected wave B black was continuing as a flat is now invalidated. This upward structure from the low at 1,008 does not now look like a satisfactory B wave.
We still have two wave counts at the daily chart level. Both are expecting downward movement today. The main wave count above has a much better look and expects wave 4 blue to end lower. The alternate presented at the end of this analysis expects wave 4 blue is already over.
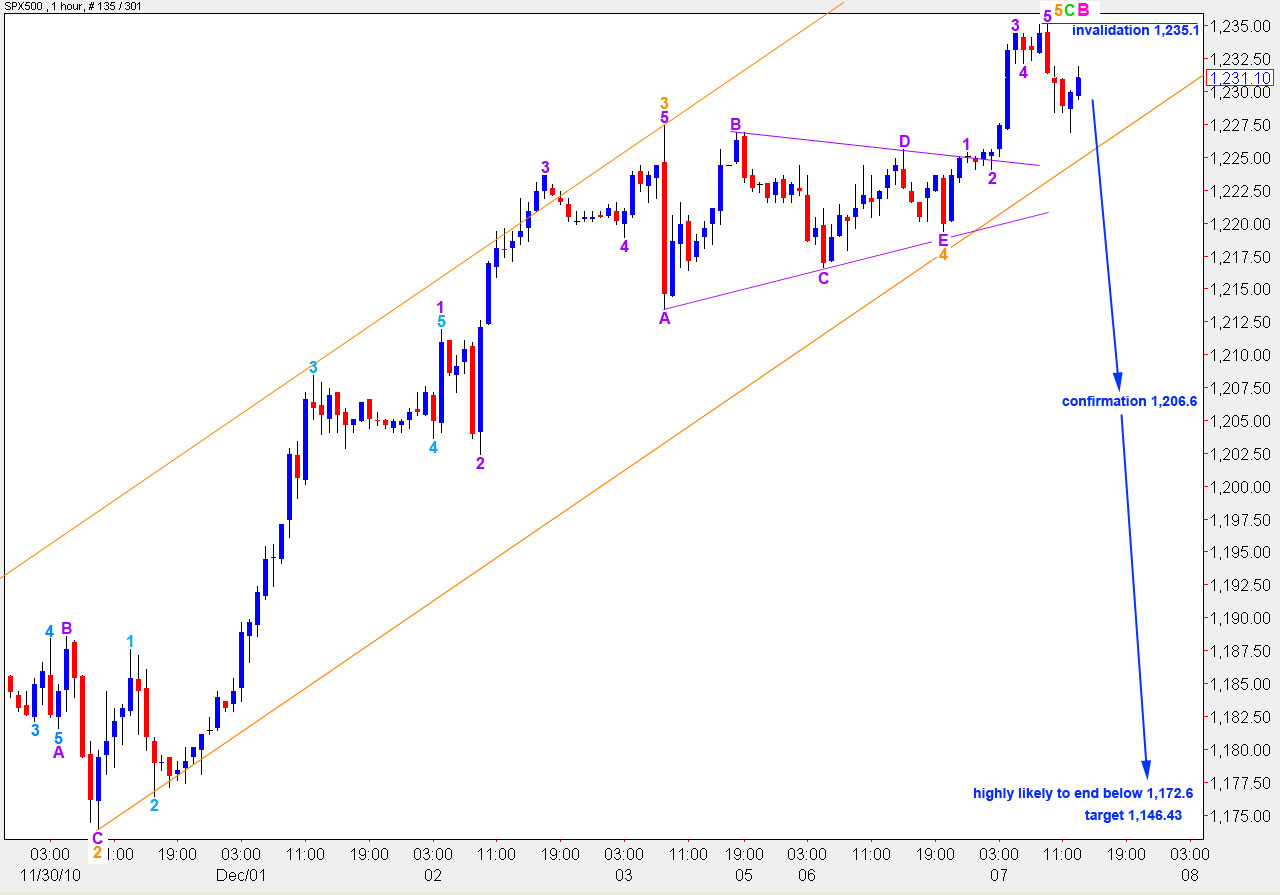
The triangle structure remained valid. Wave E purple extended a little lower but did not move beyond the end of C at 1,216.6. The upwards thrust out of the triangle that we were expecting was 15.7 points long, which was expected.
We may have just seen a trend change at minute degree for the S&P. The triangle structure in a fourth wave position and the resulting expected thrust length adds weight to this wave count, at least on the hourly chart level.
Ratios within wave C green are: wave 3 orange is 7.7 points longer than 2.618 the length of wave 1 orange and wave 5 orange is just 1.8 points short of equality with wave 1 orange. Wave 2 orange was a zigzag and wave 4 orange was a triangle, giving this impulse nice alternation.
Ratios within wave 5 orange are: wave 3 purple is just 0.6 points longer than 1.618 the length of wave 1 purple and wave 5 purple is just 0.7 points short of 0.618 the length of wave 1 purple (it is exactly half the length of wave 1, but this is not a fibonacci ratio).
When we see price move below the lower edge of the orange parallel channel which contains wave C green impulse then we shall consider that confirmation of this trend change.
Price movement below 1,206.6 will invalidate the alternate wave count and thereby confirm this one.
Alternate Wave Count.
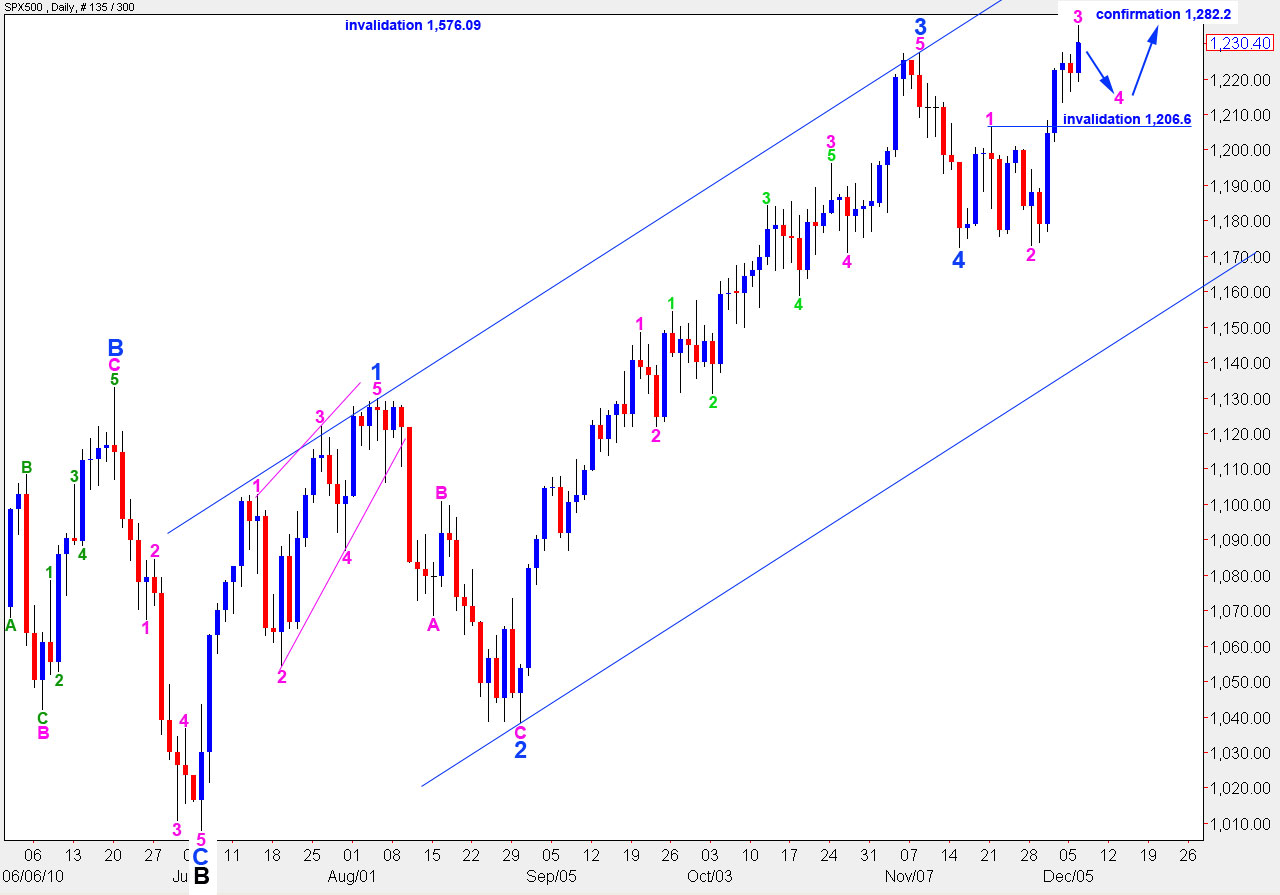
This remains technically viable but it looks less likely.
This wave count expects downwards movement also, for a fourth wave.
Wave 4 pink may not move into wave 1 pink price territory. Therefore, this wave count is invalidated with movement below 1,206.6.