
Elliott Wave chart analysis for the SPX500 for 3rd December, 2010. Please click on the charts below to enlarge.
Upward movement has reached the maximum limit if wave 4 blue is a zigzag. However, wave A pink within it may easily be seen as corrective. Therefore, wave 4 blue may be a flat correction. The most common type of flat is an expanded flat where B is at least 105% of A. Therefore, if price moves above 1,227.4 we should expect it to at least reach 1,230.2, and up to 138% of A pink at 1,248.2.
The maximum length for wave B within an expanded flat correction is twice the length of wave A. Therefore, above 1,282.2 we will have confirmation that wave 4 blue was over and our alternate wave count for wave 4 blue is correct.
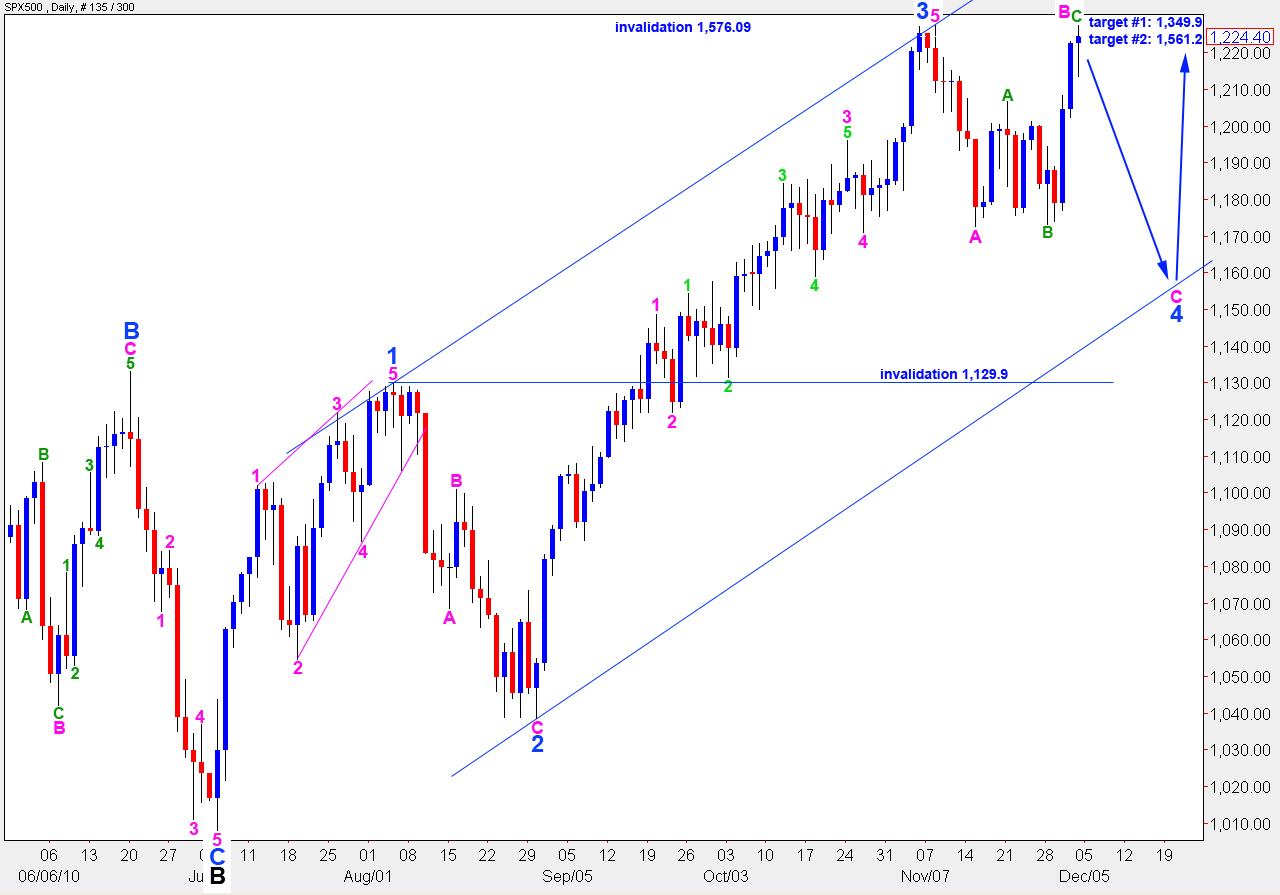
Upward targets remain the same. I favour the higher target at 1,561.2 where wave C black will reach equality with wave A black as that is the most common relationship between the two within a zigzag.
Upward movement may not make a new high above 1,576.09.
The S&P moved mostly sideways during Friday’s session, but touched 1,227.4 before bouncing sharply downwards from this point.
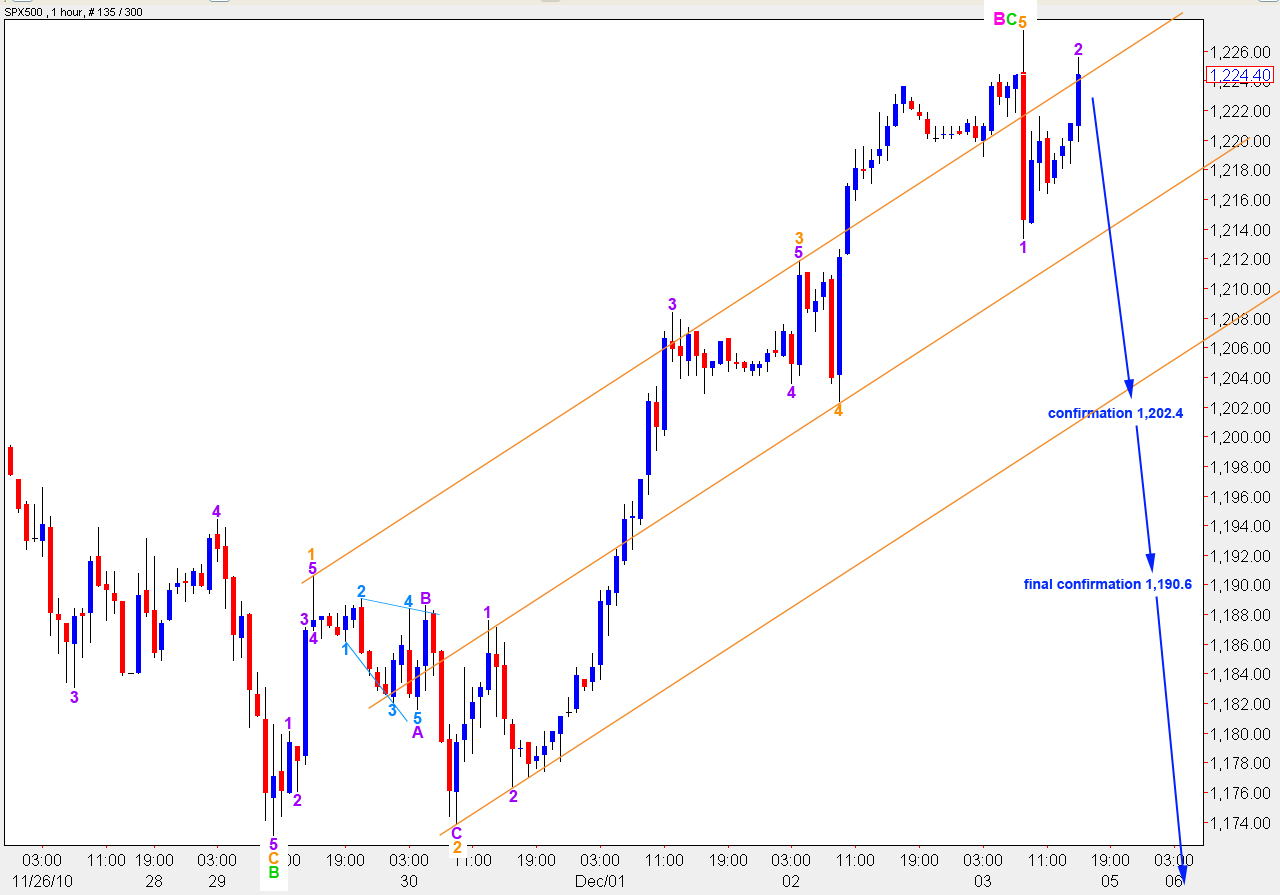
Ratios within wave C green are: wave 3 orange was 7.8 points short of 2.618 the length of wave 1 orange and wave 5 orange is 1.5 points short of 0.618 the length of wave 3 orange.
Movement below the lower edge of this wide orange parallel channel will be our first indication that wave B pink is over and wave C pink to the downside is underway.
Movement below 1,202.4, and subsequently below 1,190.6, will confirm this wave count.
Only movement above 1,282.2 will invalidate this wave count.
If we see price move above 1,227.4 then expect it to continue upwards to end between 1,230.4 and 1,248.2.
Alternate Wave Count.
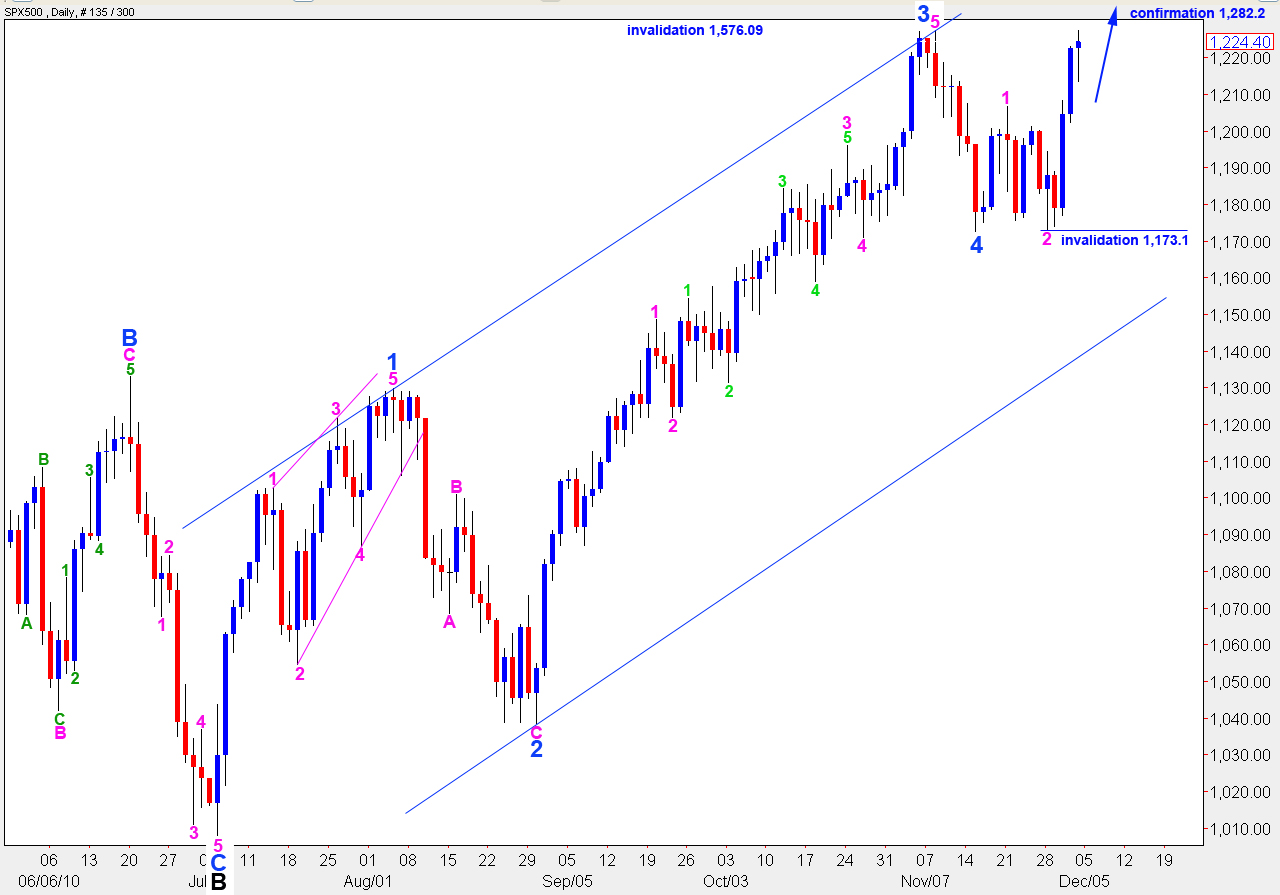
Upward movement above 1,227.4 is not confirmation of this wave count, as previously published. As it is possible to see downward movement labeled here 4 blue as a corrective structure it is, therefore, possible that wave 4 blue is unfolding as a flat correction which allows for B to move beyond the start of A.
Movement above 1,248.2 will increase the likelihood of this wave count, and movement above 1,282.2 will confirm it.
At that stage, we may expect further upward movement toward the target of 1,561.2 is highly likely.
Alternate Daily Wave Count.
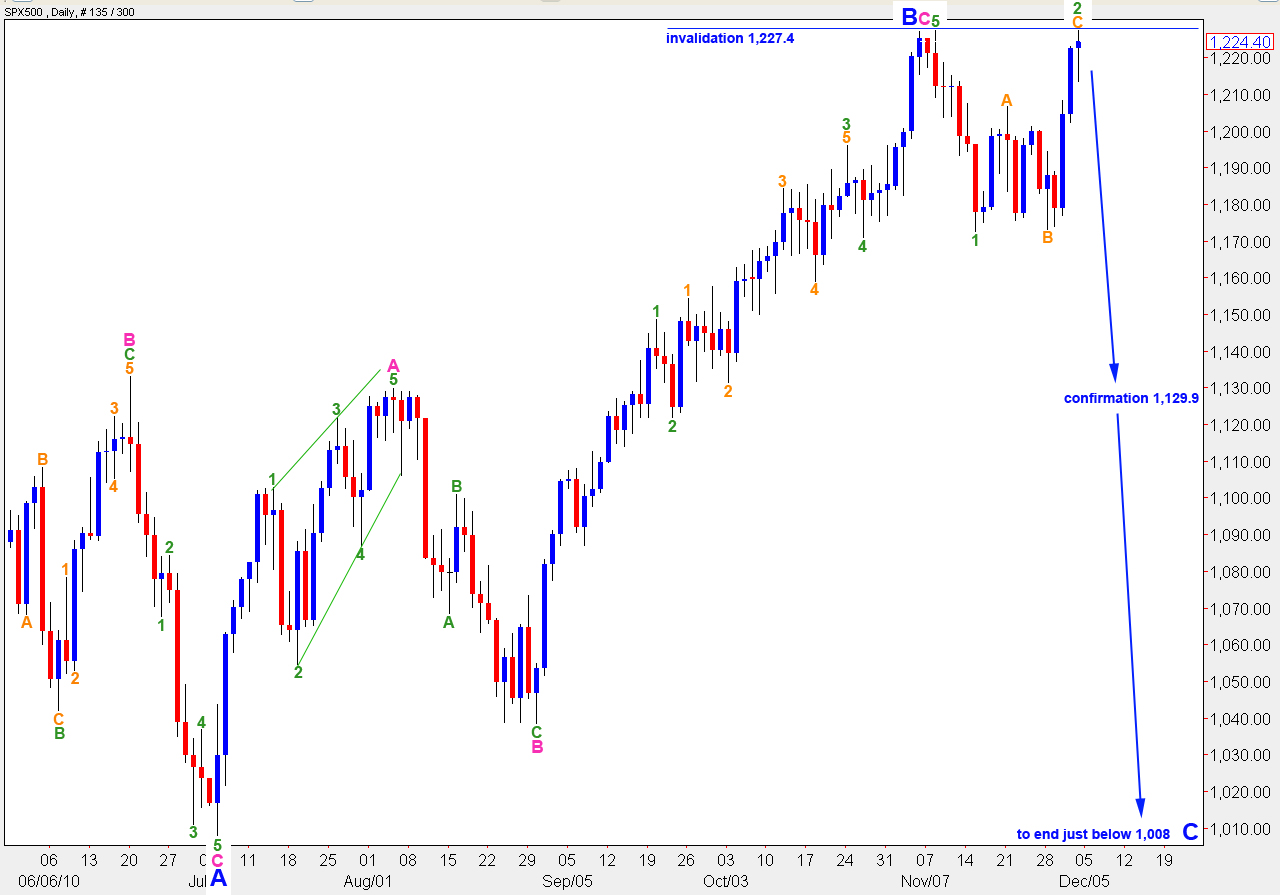
Analysis for this alternate count remains the same. This alternate wave count expects wave B black is still unfolding as a regular flat correction.
Wave B blue was 103% the length of wave A blue. Therefore, this structure is a regular flat correction and wave C blue is most likely to end just beyond the end of wave A blue, just below 1,008.
If the main wave count is invalidated with movement below 1,129.9 this alternate wave count will be correct. At that stage we may expect there is a very high probability of downward movement continuing and ending only below 1,008.
Wave 2 green may not move beyond the end of wave 1 green. Therefore, this wave count is invalidated with movement above 1,227.4.